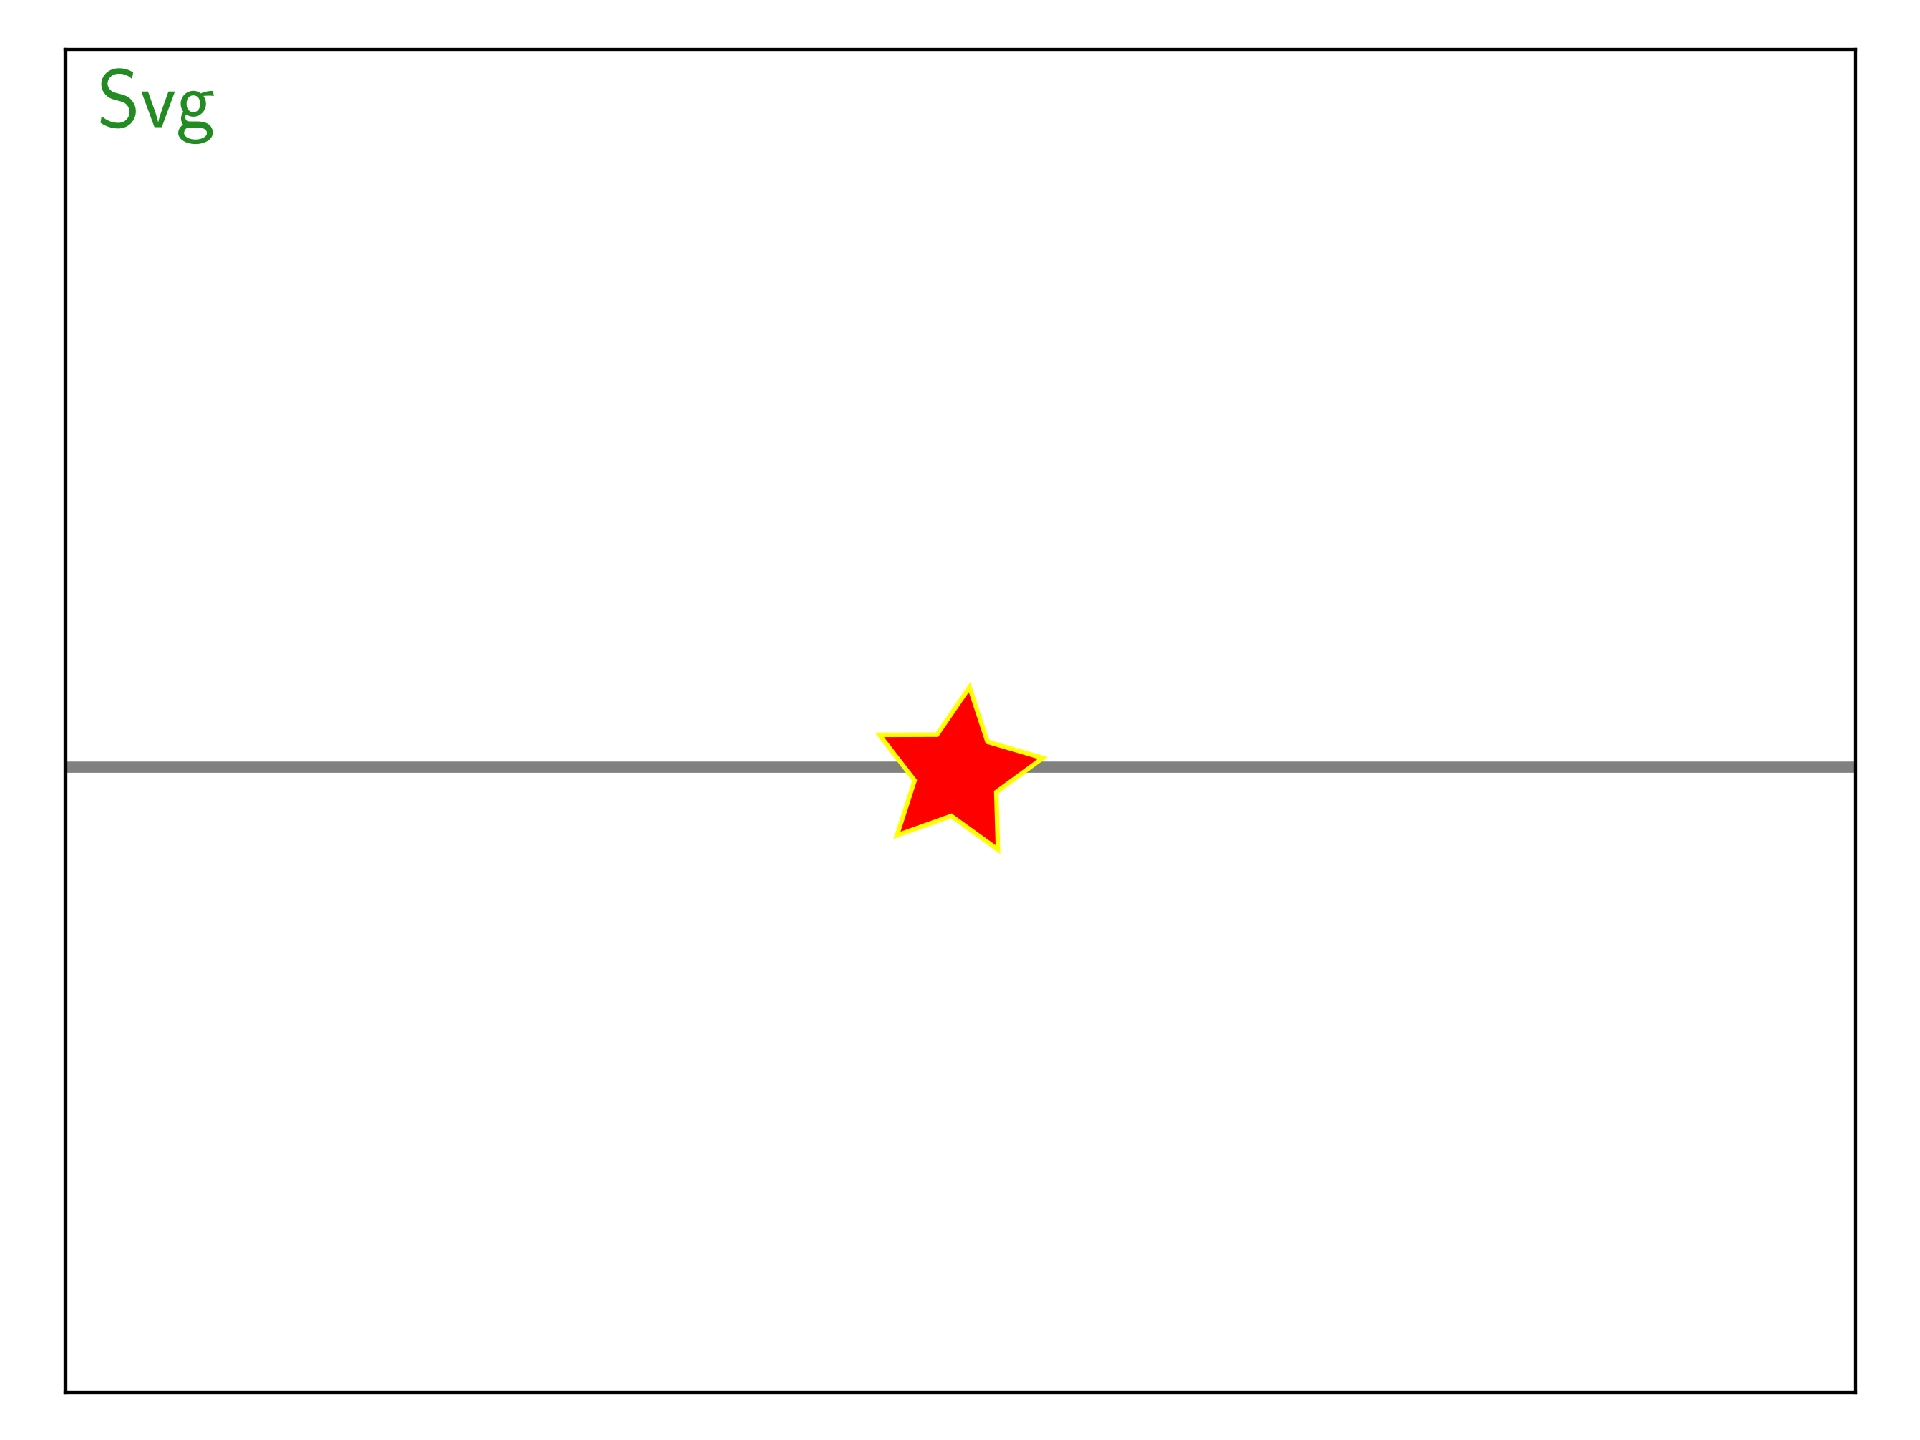
svg
Create graphical elements using svg syntax.
To make svg writing easier, shortcuts module have been created to draw (line, rectangle, grid)
from beampy import *

# Remove quiet=True to get Beampy render outputs
doc = document(quiet=True)

with slide('Svg'):
    svg('<rect width="800px" height="5" style="fill:grey;"/>', y='center')

    svg("""<g transform="translate(-54.26034,-59.292535)"> <path d="m
    109.59577,134.50956 -20.858493,-15.04546 -24.219093,8.65323
    7.863454,-24.48691 -15.713821,-20.359732 25.718378,-0.08828
    14.507417,-21.236235 8.031378,24.43235 24.6799,7.235016 -20.75472,15.188303
    z" style="fill:#ff0000;stroke:#ffff00;stroke-width:2;stroke-linecap:butt;"
    /> </g>""", x='center', y='center')


display_matplotlib(gcs())

Module arguments
-
class
beampy.svg(svg_content, **kwargs) Insert svg content.
Parameters: - svg_content (string) – Svg elements to add written in svg syntax without svg document tag “<svg xmlns…>”
- x (int or float or {'center', 'auto'} or str, optional) – Horizontal position for the svg (the default is 0). See positioning system of Beampy.
- y (int or float or {'center', 'auto'} or str, optional) – Vertical position for the svg (the default is 0). See positioning system of Beampy.