tikz
Add pgf/tikz drawing to the slide.
You could find great examples here http://www.texample.net/tikz/examples/
from beampy import *
# Remove quiet=True to get beampy compilation outputs
doc = document(quiet=True)
latex_cmd = r"\newcounter{density}\setcounter{density}{10}"
tex_packages = ['ifthen']
with slide('A tikz figure'):
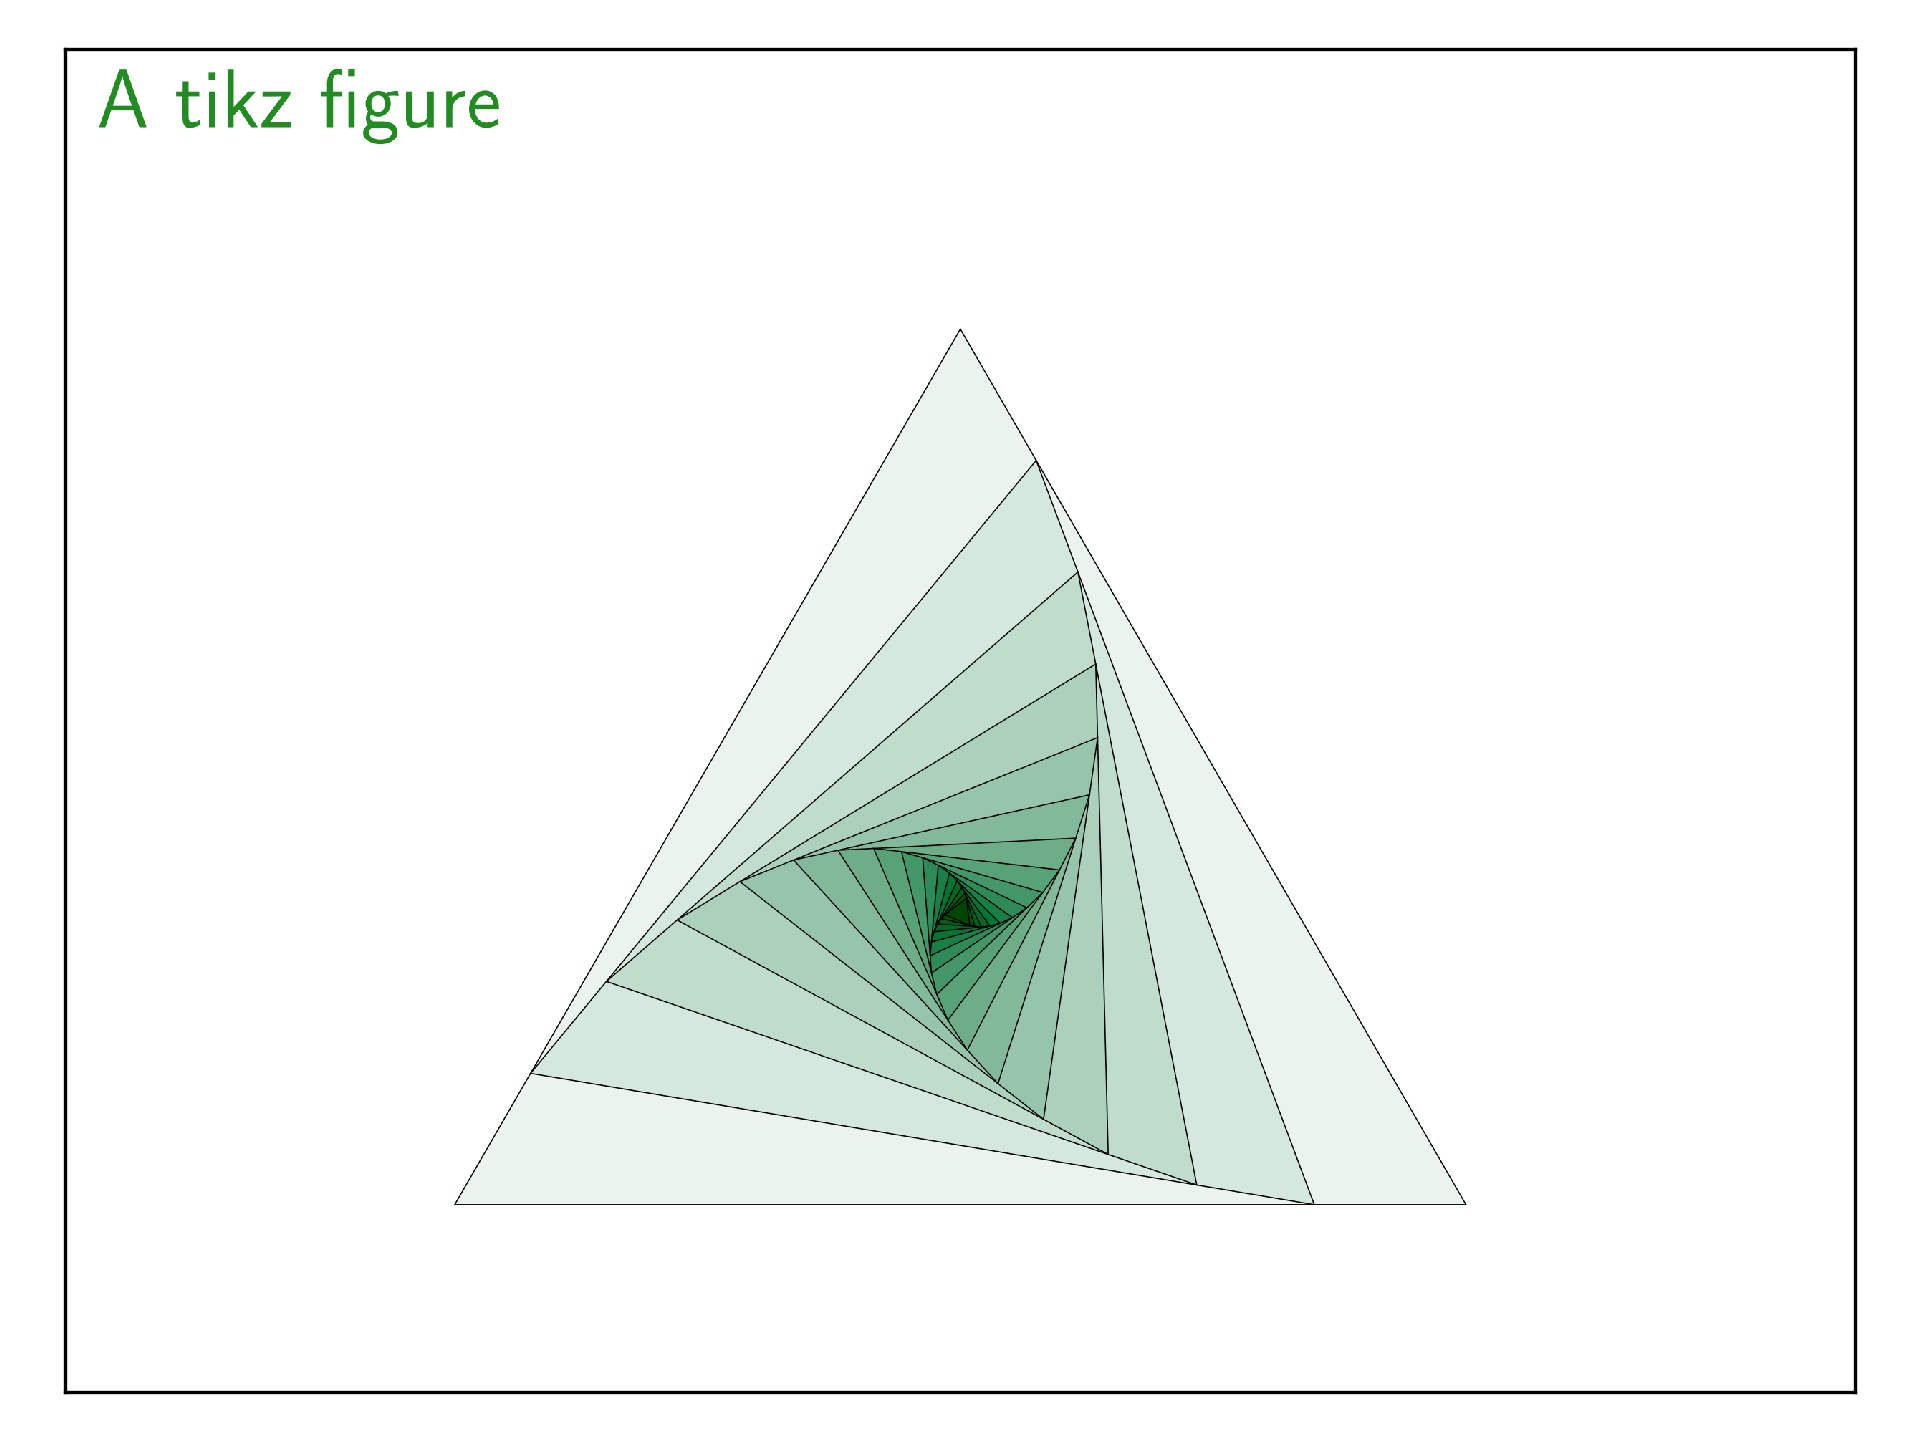
tikz(r"""
\def\couleur{SeaGreen}
\path[coordinate] (0,0) coordinate(A)
++( 60:12cm) coordinate(B)
++(-60:12cm) coordinate(C);
\draw[fill=\couleur!\thedensity] (A) -- (B) -- (C) -- cycle;
\foreach \x in {1,...,15}{%
\pgfmathsetcounter{density}{\thedensity+10}
\setcounter{density}{\thedensity}
\path[coordinate] coordinate(X) at (A){};
\path[coordinate] (A) -- (B) coordinate[pos=.15](A)
-- (C) coordinate[pos=.15](B)
-- (X) coordinate[pos=.15](C);
\draw[fill=\couleur!\thedensity] (A)--(B)--(C)--cycle;
}
""", latex_pre_tikzpicture=latex_cmd,
tex_packages=tex_packages,
x='center', y='center')
display_matplotlib(gcs())
Module arguments
-
class
beampy.tikz(tikzcmd, **kwargs) Add Tikz/pgf graphic to the slide.
Parameters: - tikzcmd (string) – String containing the main Tikz commands contained between begin{tikzpicture} and end{}tikzpicture}.
- x (int or float or {'center', 'auto'} or str, optional) – Horizontal position for the Tikz graphic (the default theme set this to 0). See positioning system of Beampy.
- y (int or float or {'center', 'auto'} or str, optional) – Vertical position for the Tikz graphic (the default theme sets this to 0). See positioning system of Beampy.
- tikz_header (str or None, optional) – Add extra Tiks/pgf libraries and style (Tiks commands usetikzlibrary and tickstyle), everything that is included before begin{document} (the default theme sets this to None).
- tex_packages (list of string or None, optional) –
Add extra Tex packages that are included using the usepackages (the default theme sets this to None). The list should only contains the name of tex packages as strings.
>>> tex_packages = [‘xolors’,’tikz-3dplot’]
- latex_pre_tikzpicture (str or None, optional) –
Add extra latex commands that will be added between begin{document} and begin{tikzpicture} (the default theme sets this to None)
>>> latex_pre_tikzpicture = r’\newcounter{mycounter}\setcounter{mycounter}{10}’ - figure_options (string or None,) – Tikz options added just after: begin{tikzpicture}[options] (the default theme sets this to None).
- figure_anchor ({'top_left' or 'top_right' or 'bottom_left' or 'bottom_right' }, optional) – Anchor of the svg produced by Tikz.