Beampy Positioning system
Beampy has a positioning system that allows to make automatic, fixed or relative positioning. The default behavior is set by the theme used in the presentation.
The default theme sets the coordinates to:
- x=’center’ which means that element is centered in the horizontal direction
- x element anchor is set to left, which means that the horizontal distance is computed between to left side of the slide and the left border of the element bounding-box.
- y=’auto’ which means that elements are equally spaced on the vertical direction.
- y element anchor is set to top, which means that the vertical distance is computed between the top of the slide and the top border of the element bounding-box.
- The reference for computing coordinates as percent is the page or group width for both x and y.
Slide coordinate system
The origin of the coordinate coordinate system is the upper-left corner of the slide or the current group. And is positive when moving toward the bottom-right corner.
from beampy import *
from beampy.utils import bounding_box, draw_axes
doc = document(quiet=True)
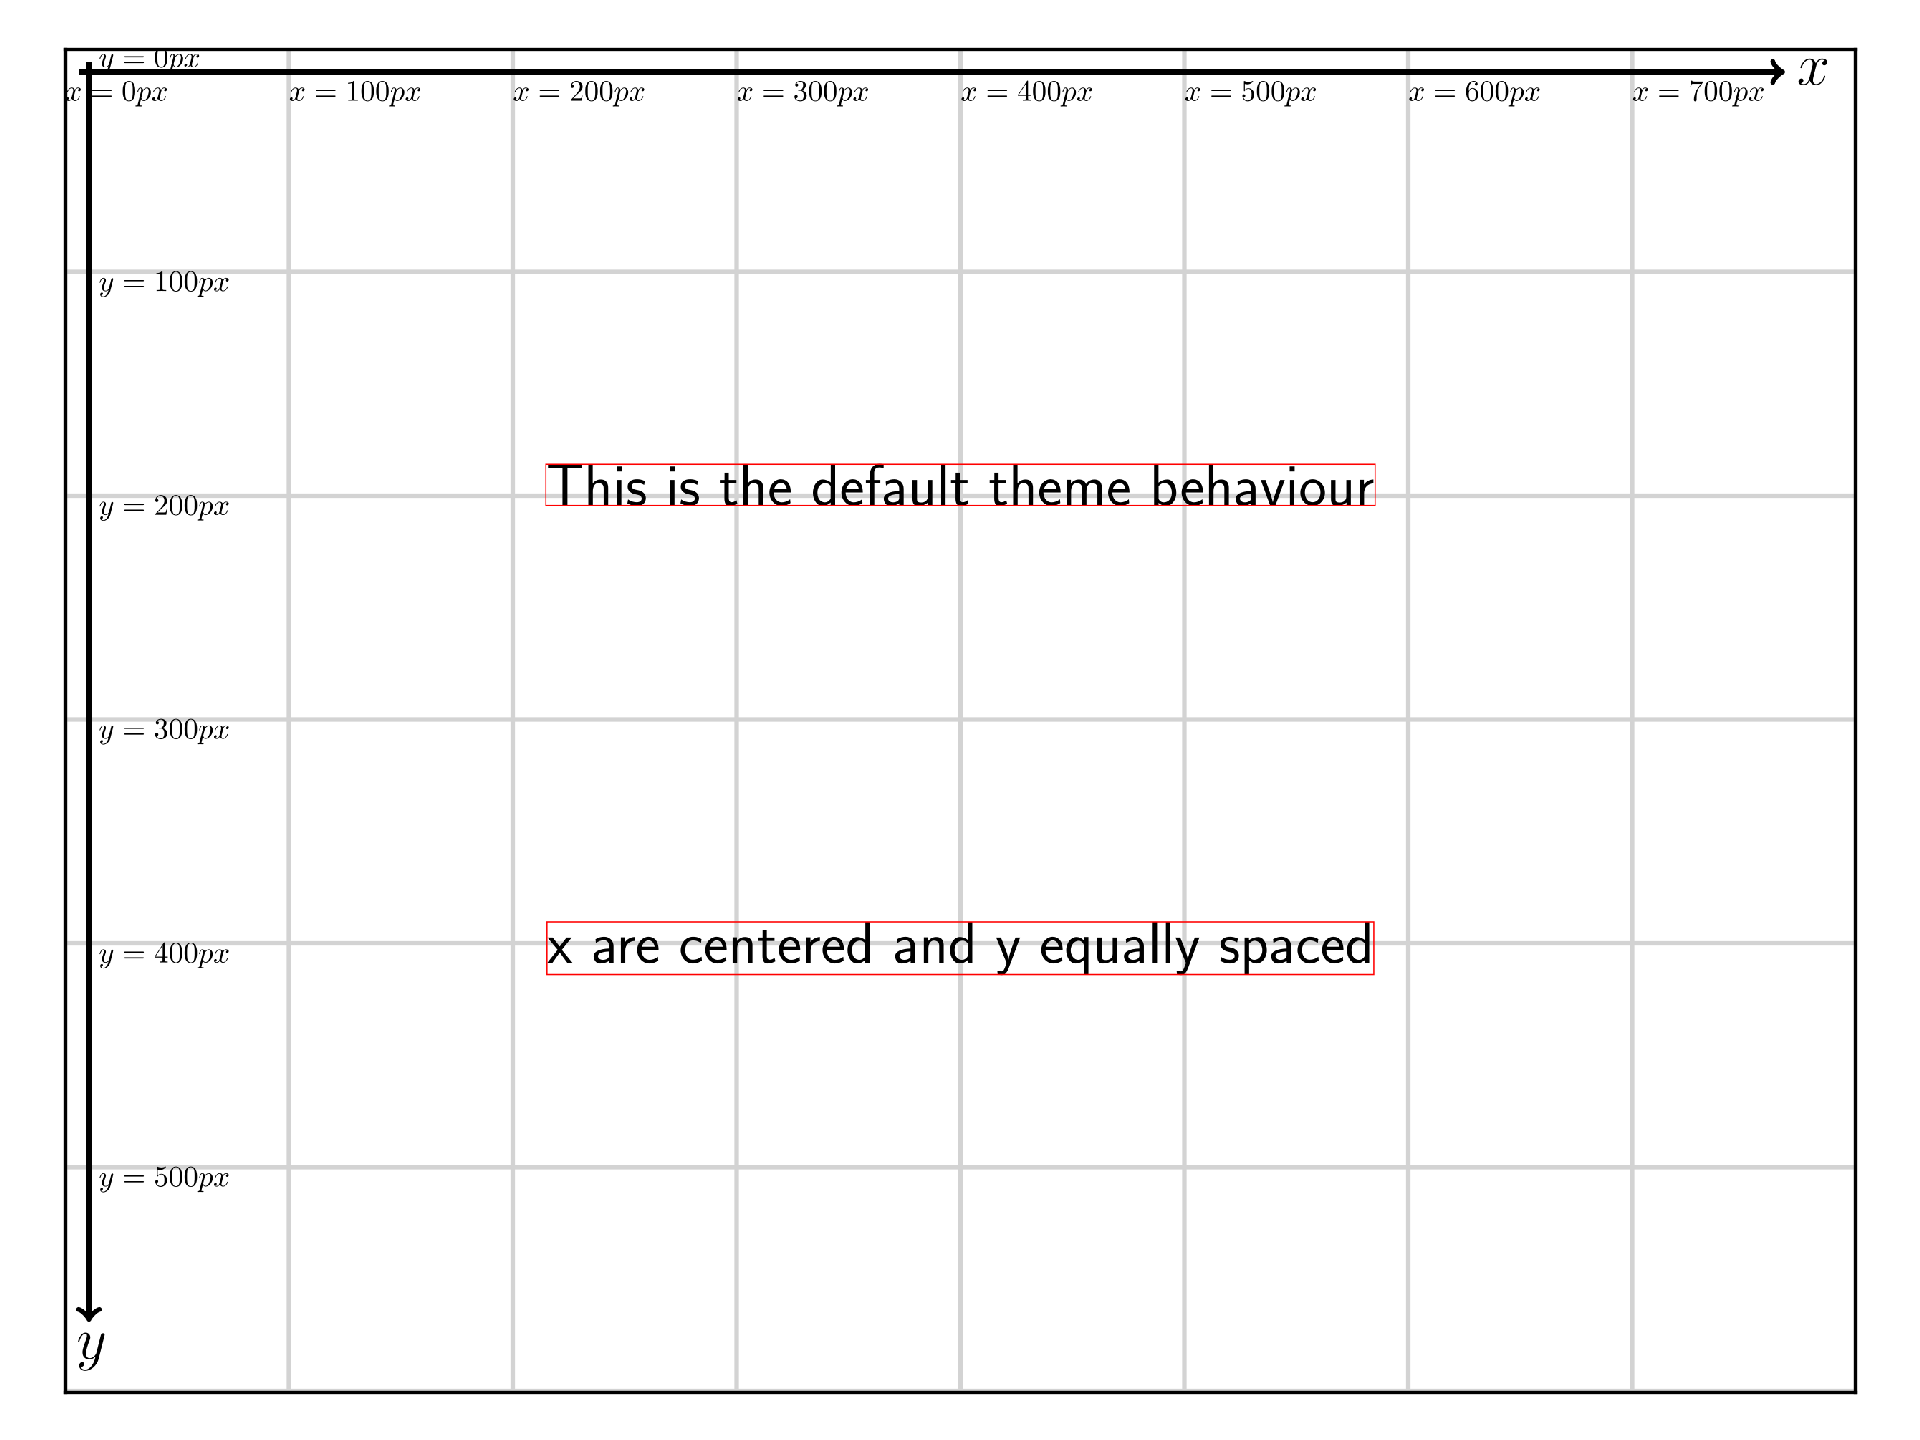
with slide():
draw_axes(show_ticks=True)
t1 = text('This is the default theme behaviour')
t2 = text('x are centered and y equally spaced')
for t in [t1, t2]:
t.add_border()
display_matplotlib(gcs())
Automatic positioning
Beampy as some simple automatic positioning, which are ‘centering’ the Beampy module with center, and equally spaced distribution of Beampy modules that have auto as coordinates
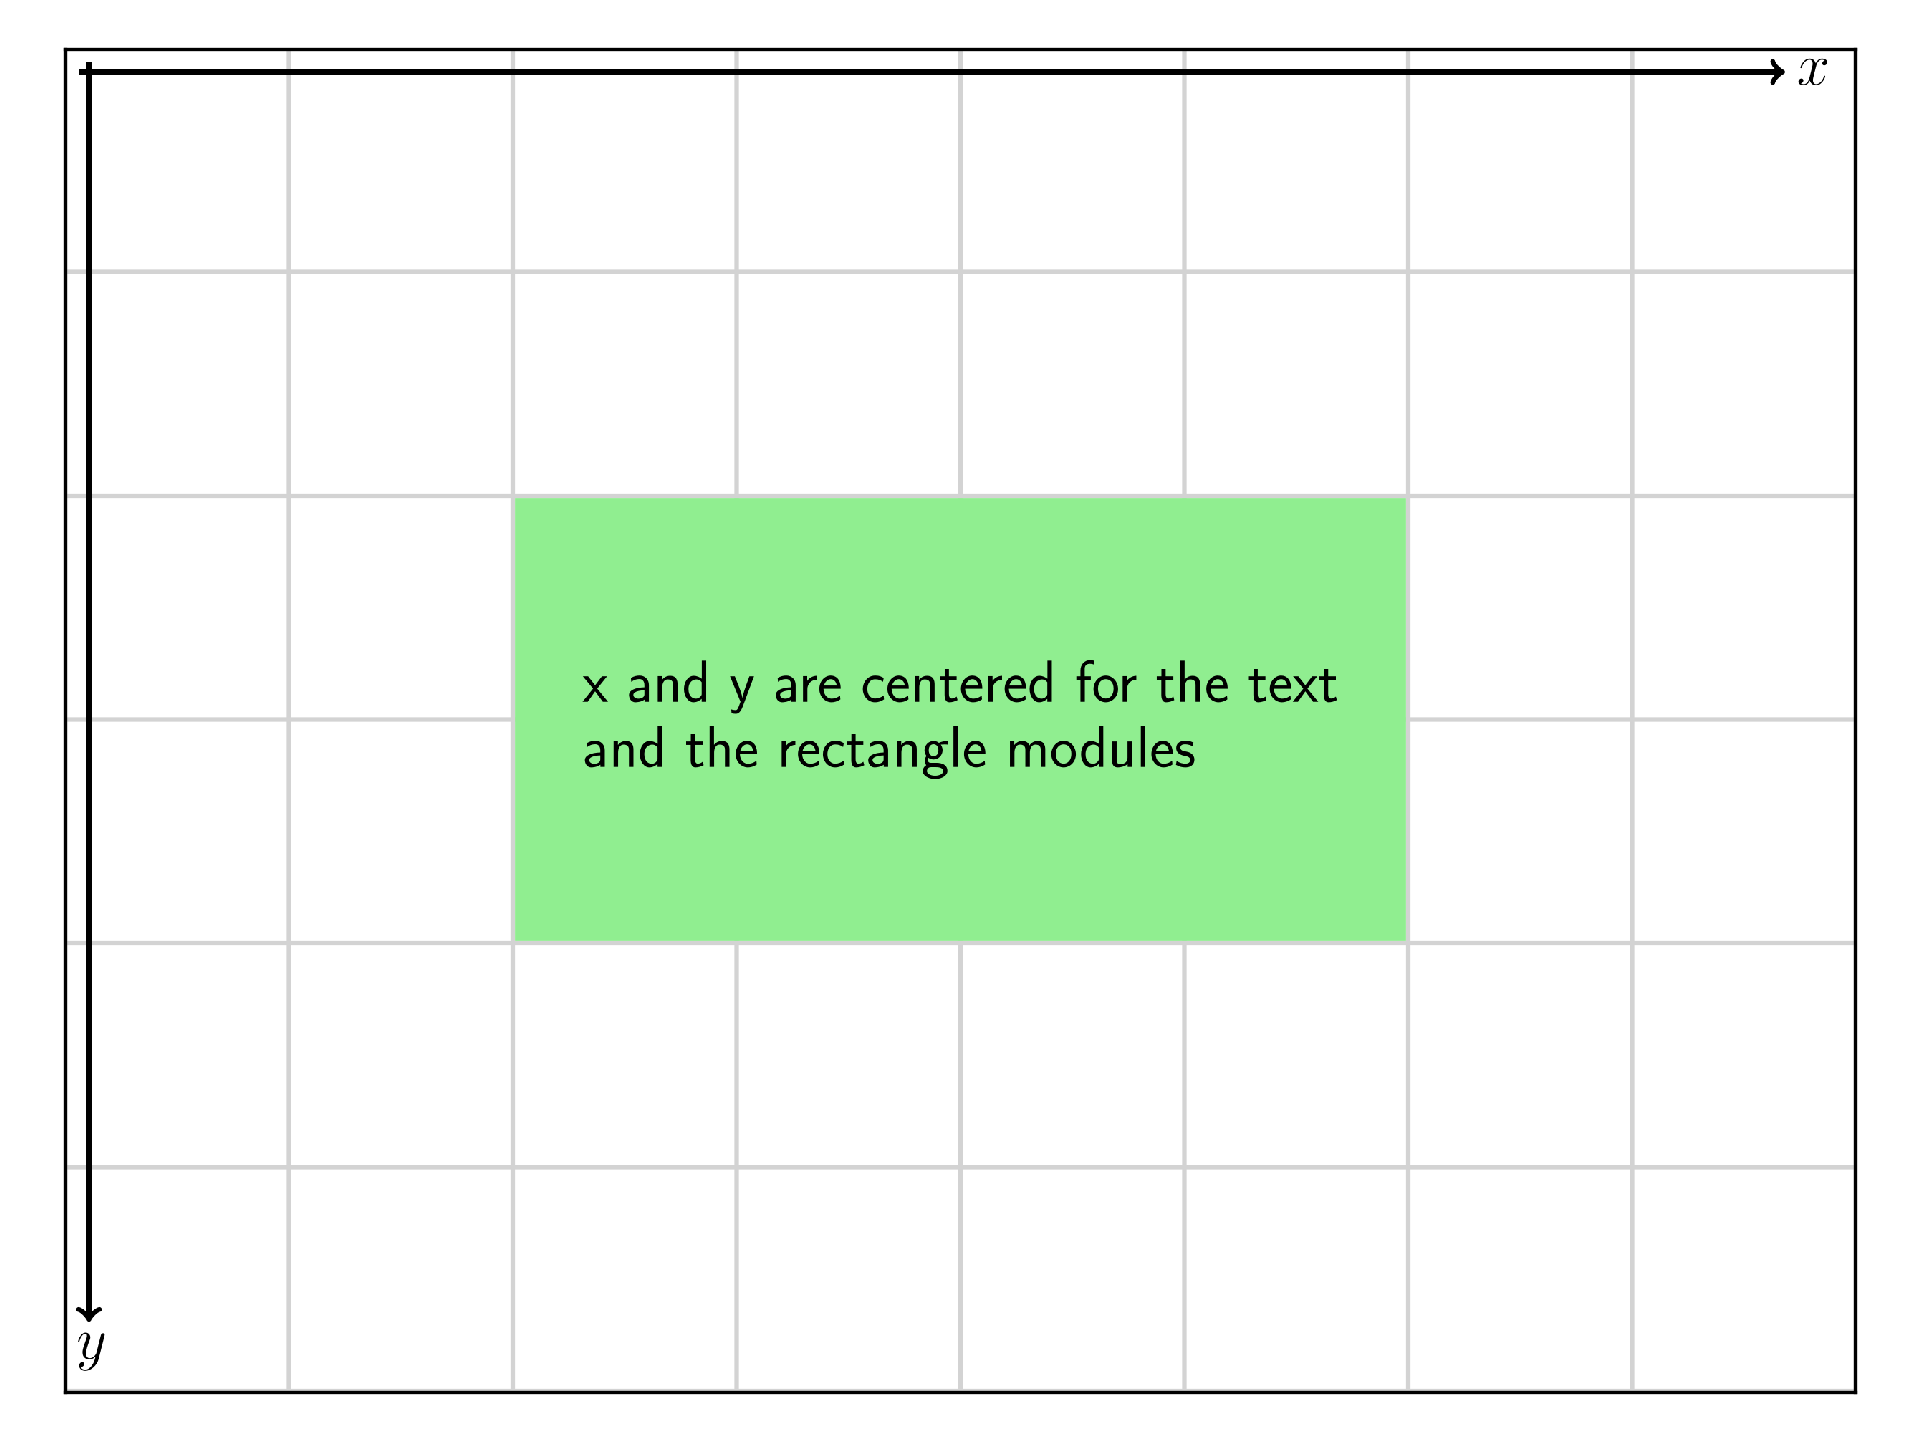
Centering
with slide():
    draw_axes()
    rectangle(x='center', y='center', width=400, height=200,
              color='lightgreen', edgecolor=None)
    text('x and y are centered for the text and the rectangle modules',
         x='center', y='center', width=350)

display_matplotlib(gcs())
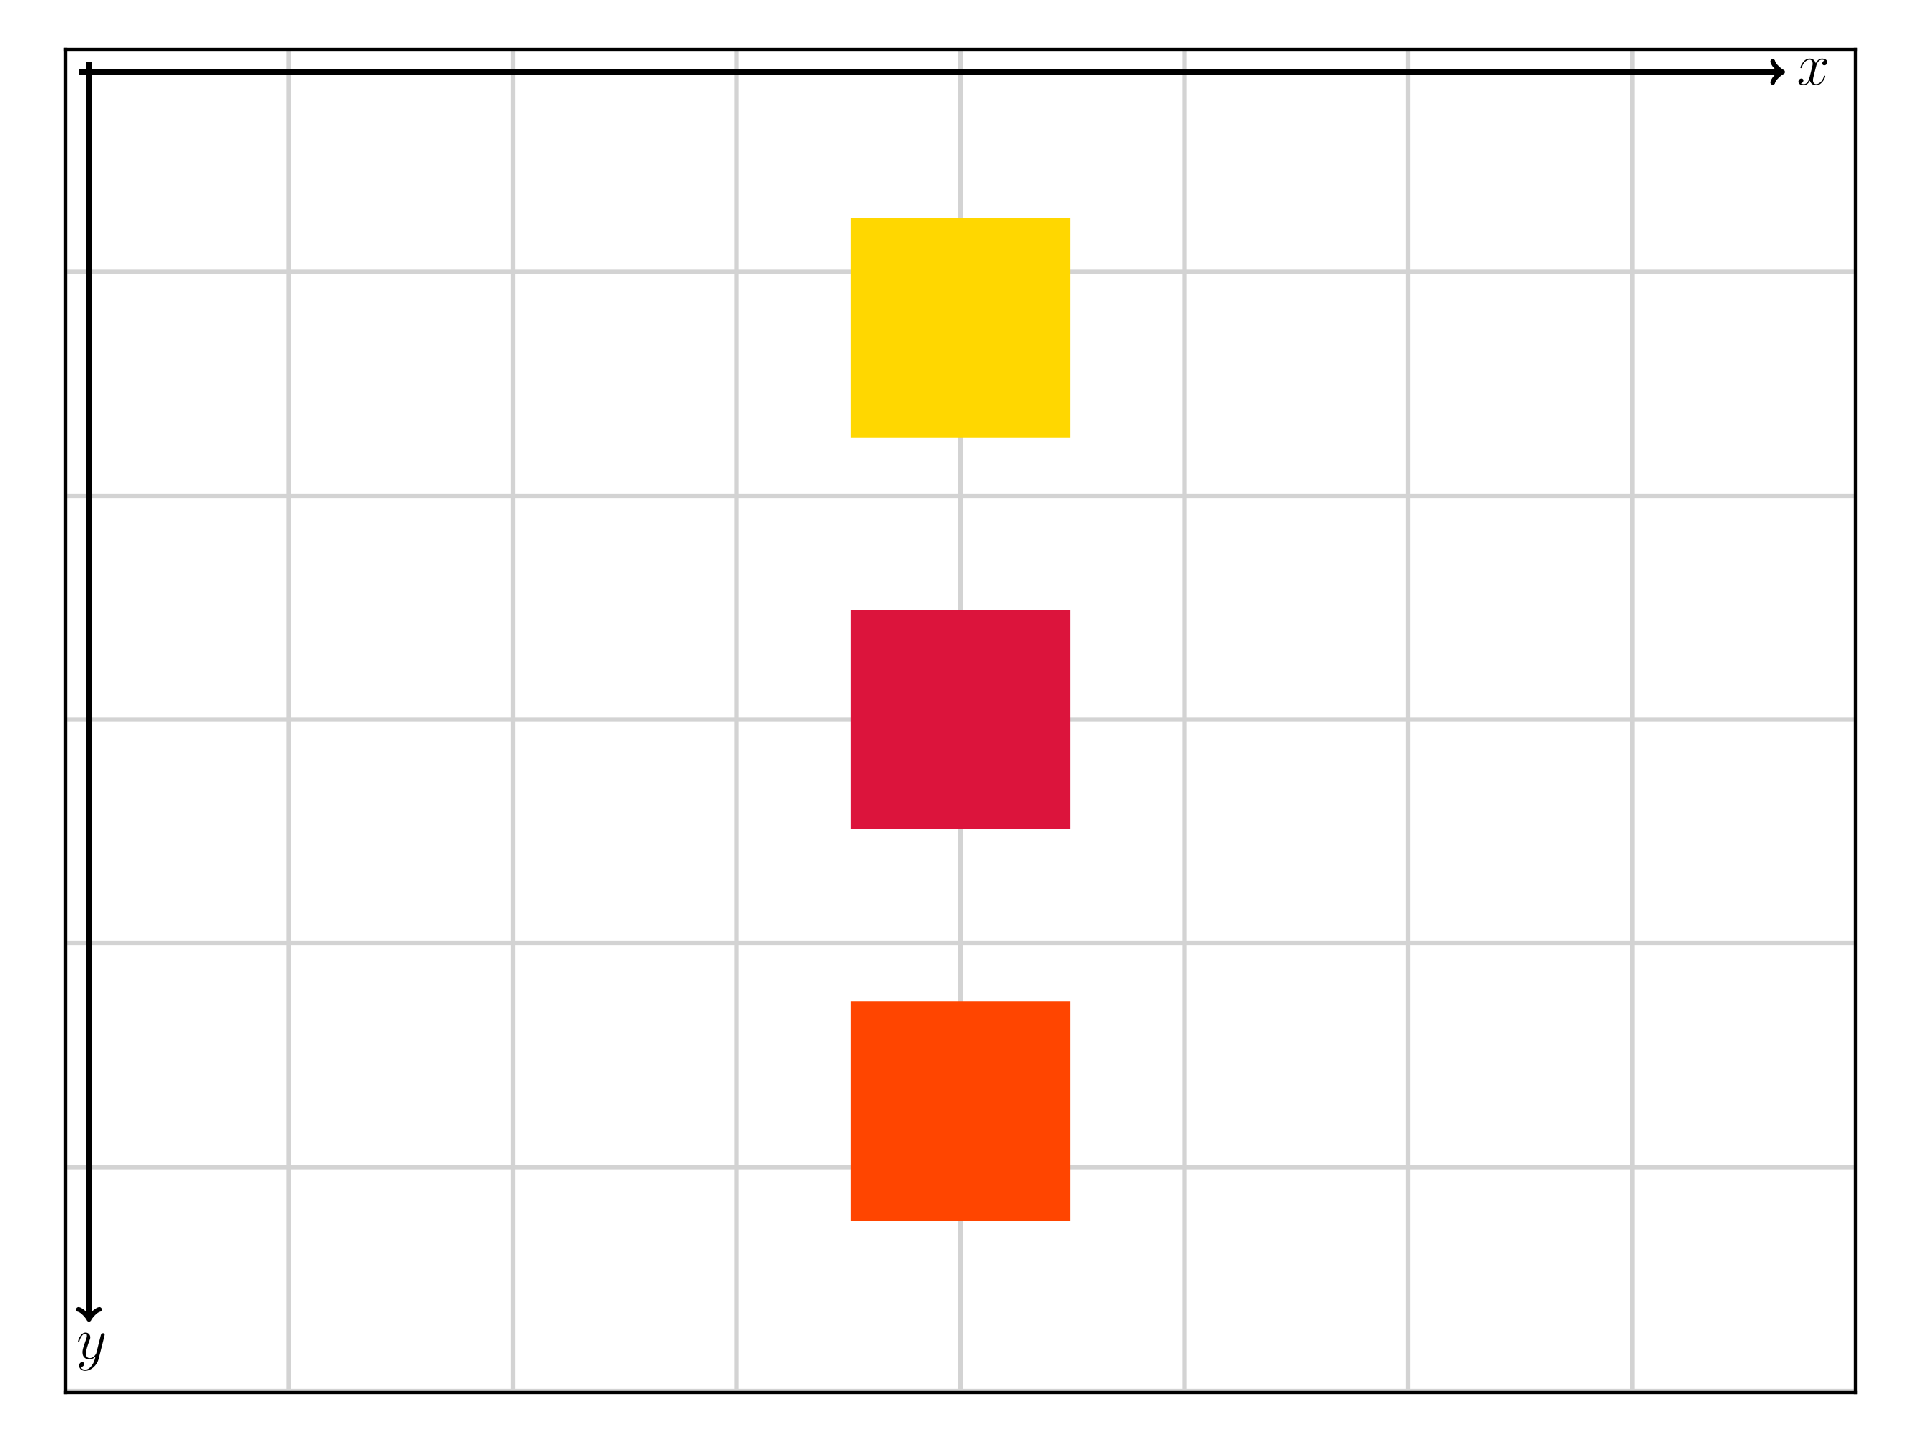
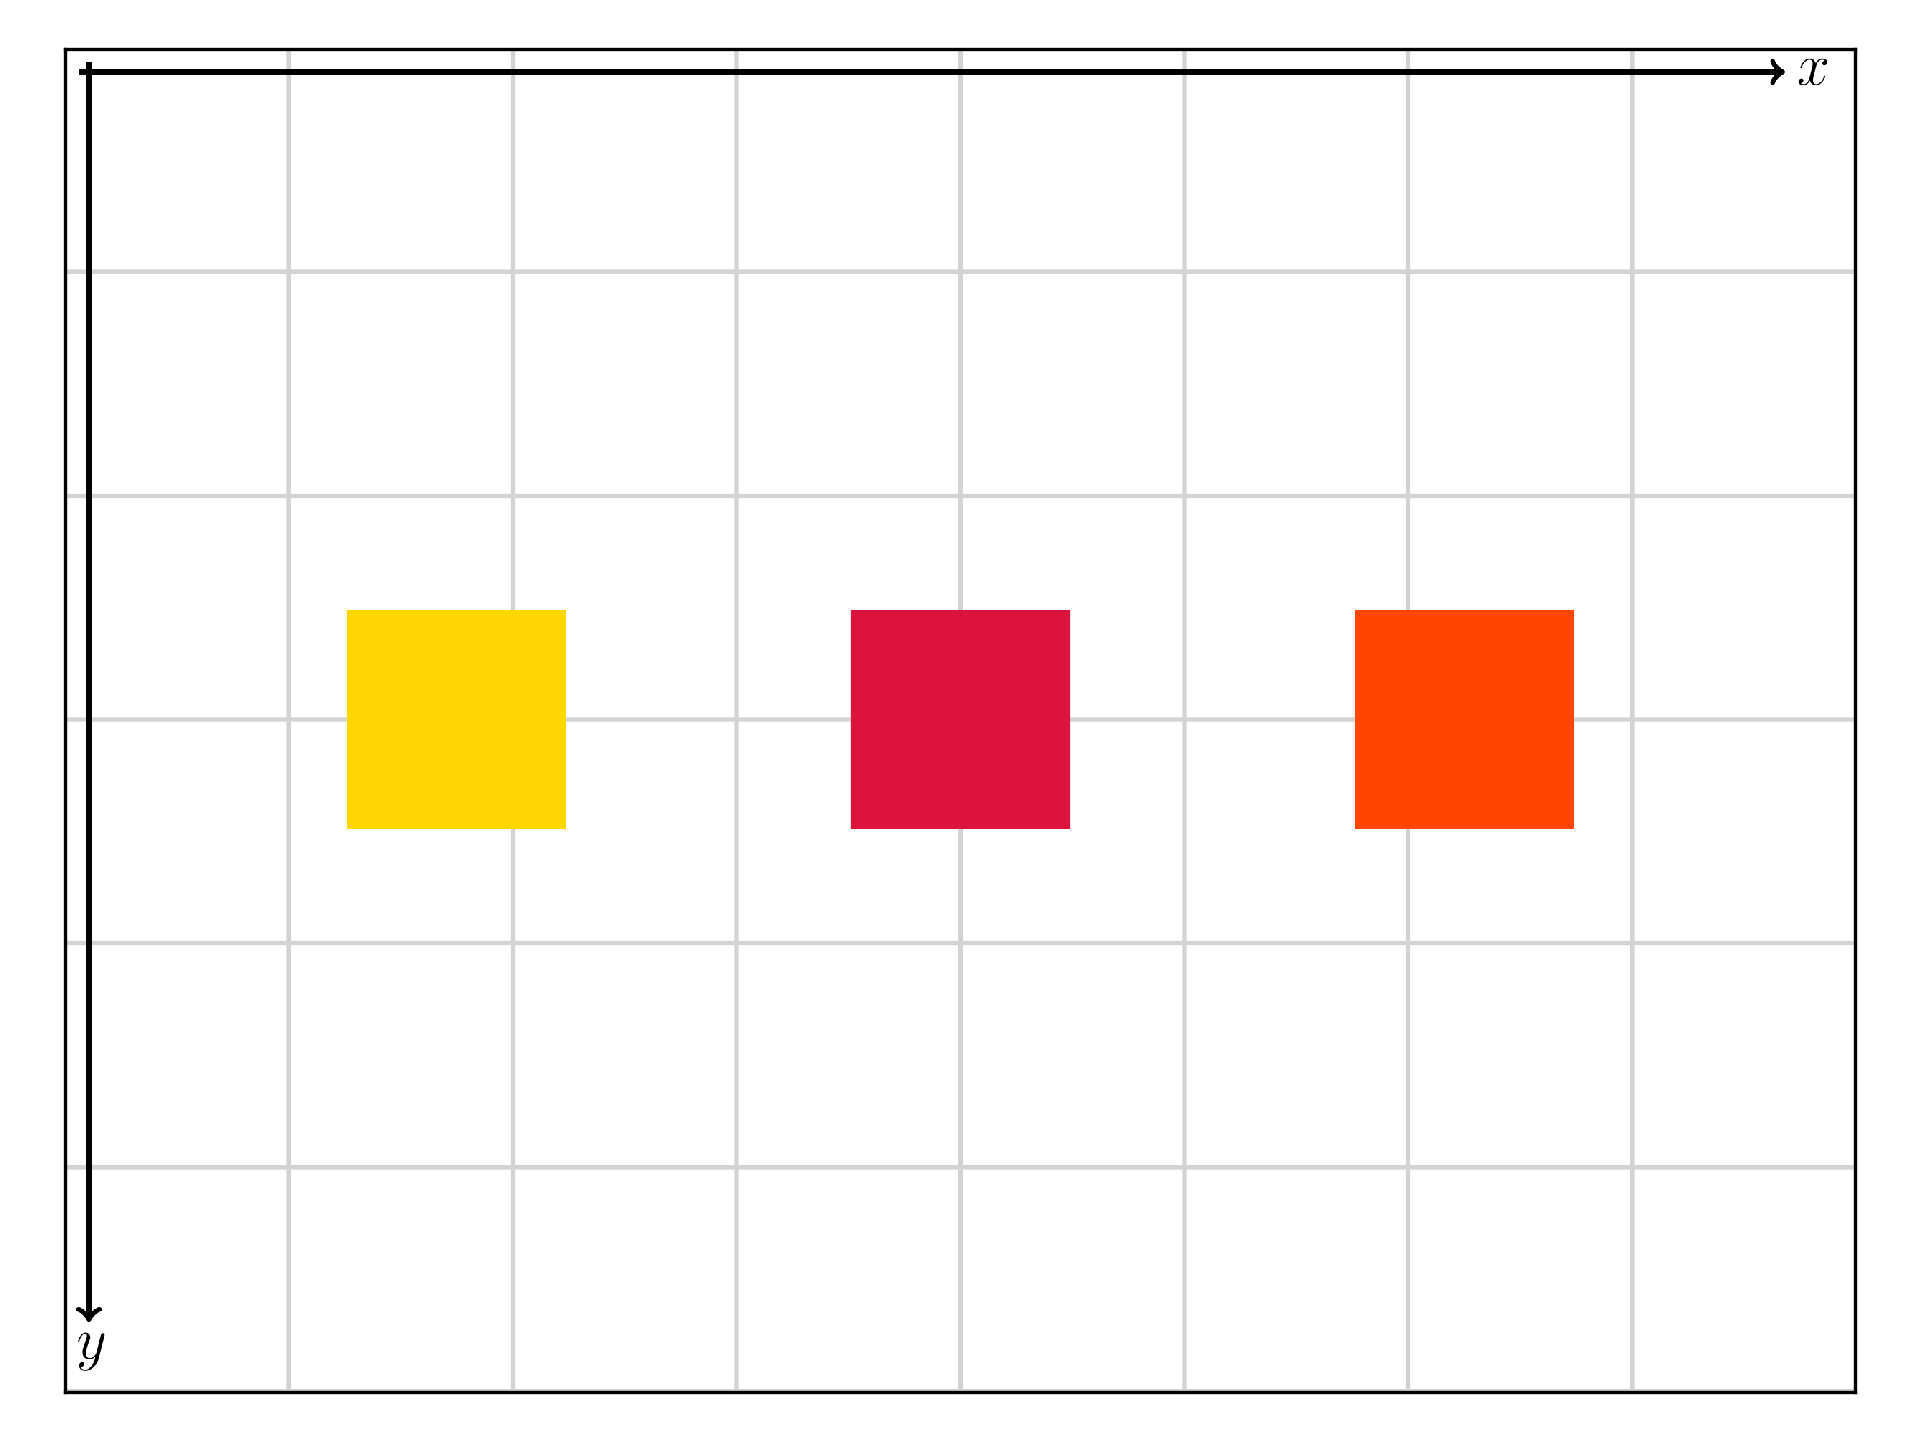
Auto
Equally spaced vertically
with slide():
    draw_axes()
    for c in ['gold', 'crimson', 'orangered']:
        rectangle(x='center', y='auto', width=100, height=100,
                  color=c, edgecolor=None)

display_matplotlib(gcs())
Equally spaced horizontally
with slide():
    draw_axes()
    for c in ['gold', 'crimson', 'orangered']:
        rectangle(x='auto', y='center', width=100, height=100,
                  color=c, edgecolor=None)

display_matplotlib(gcs())
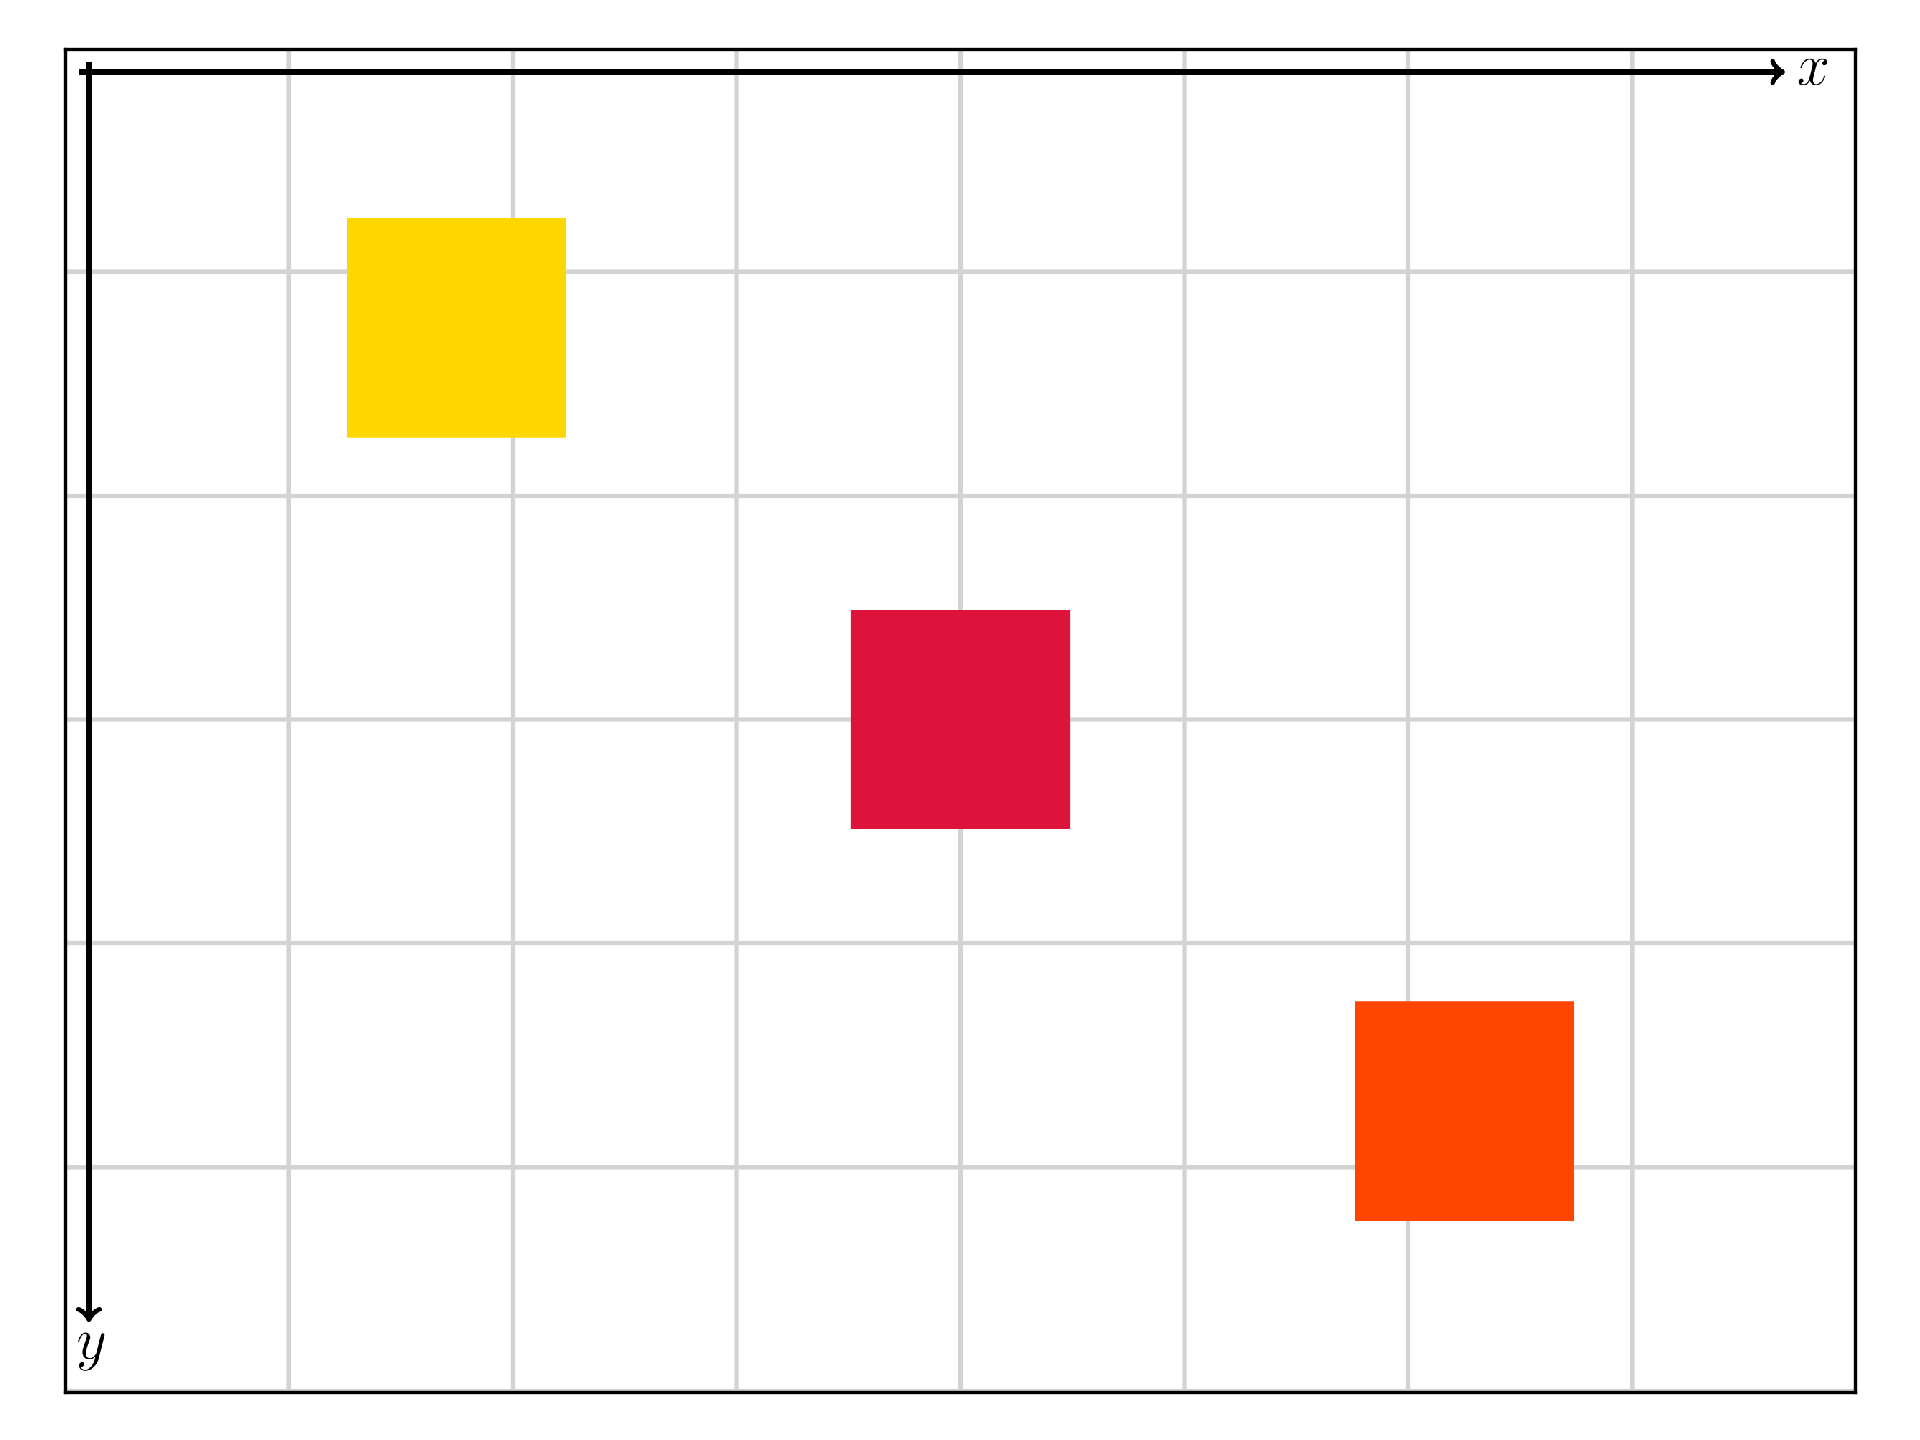
Equally spaced in xy directions
with slide():
    draw_axes()
    for c in ['gold', 'crimson', 'orangered']:
        rectangle(x='auto', y='auto', width=100, height=100,
                  color=c, edgecolor=None)

display_matplotlib(gcs())
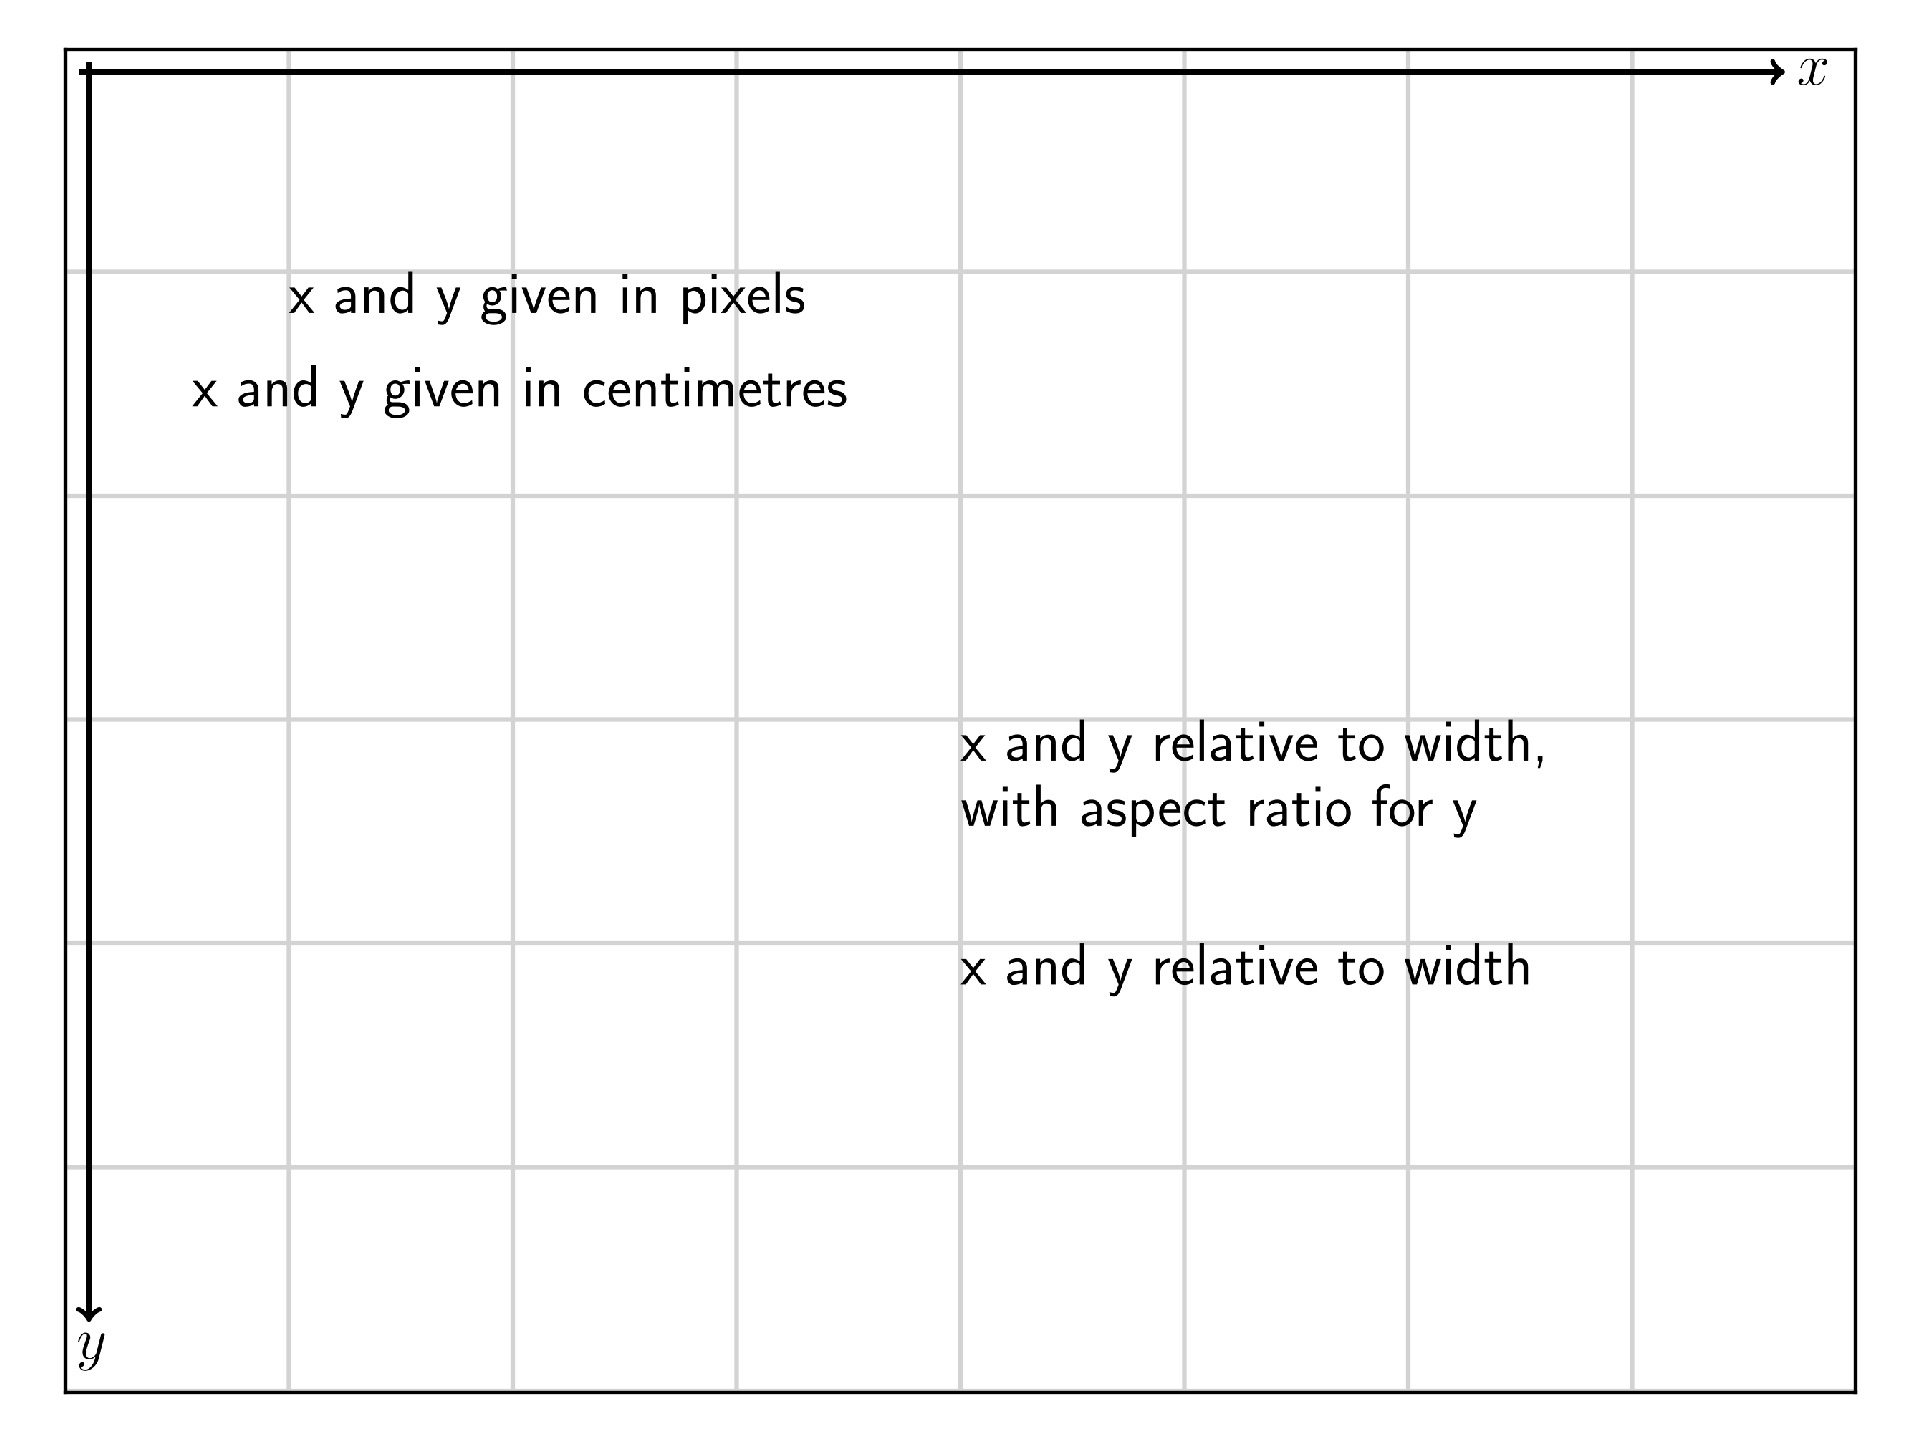
Absolute positioning
units
Absolute coordinates could be given as follow:
- (int or float) <= 1.0, the position is a percent of the slide or group width for x and y (by default, but could be changed).
- (int or float) > 1.0, the position is in pixels.
- Given as a string, the position is in pixels or in the unit given just after, like ‘2cm’.
Note
For y < 1.0, the default will be changed in future version to be percent of the height. To already change this in your slide you could add just after importing Beampy:
>>> DEFAULT_Y['unit'] = 'height'
with slide():
    draw_axes()
    text('x and y relative to width', x=0.5, y=0.5)
    text('x and y relative to width, with aspect ratio for y', x=0.5,
         y=0.5*(3/4.), width=300)
    text('x and y given in pixels', x=100, y=100)
    text('x and y given in centimetres', x='2cm', y='5cm')

display_matplotlib(gcs())
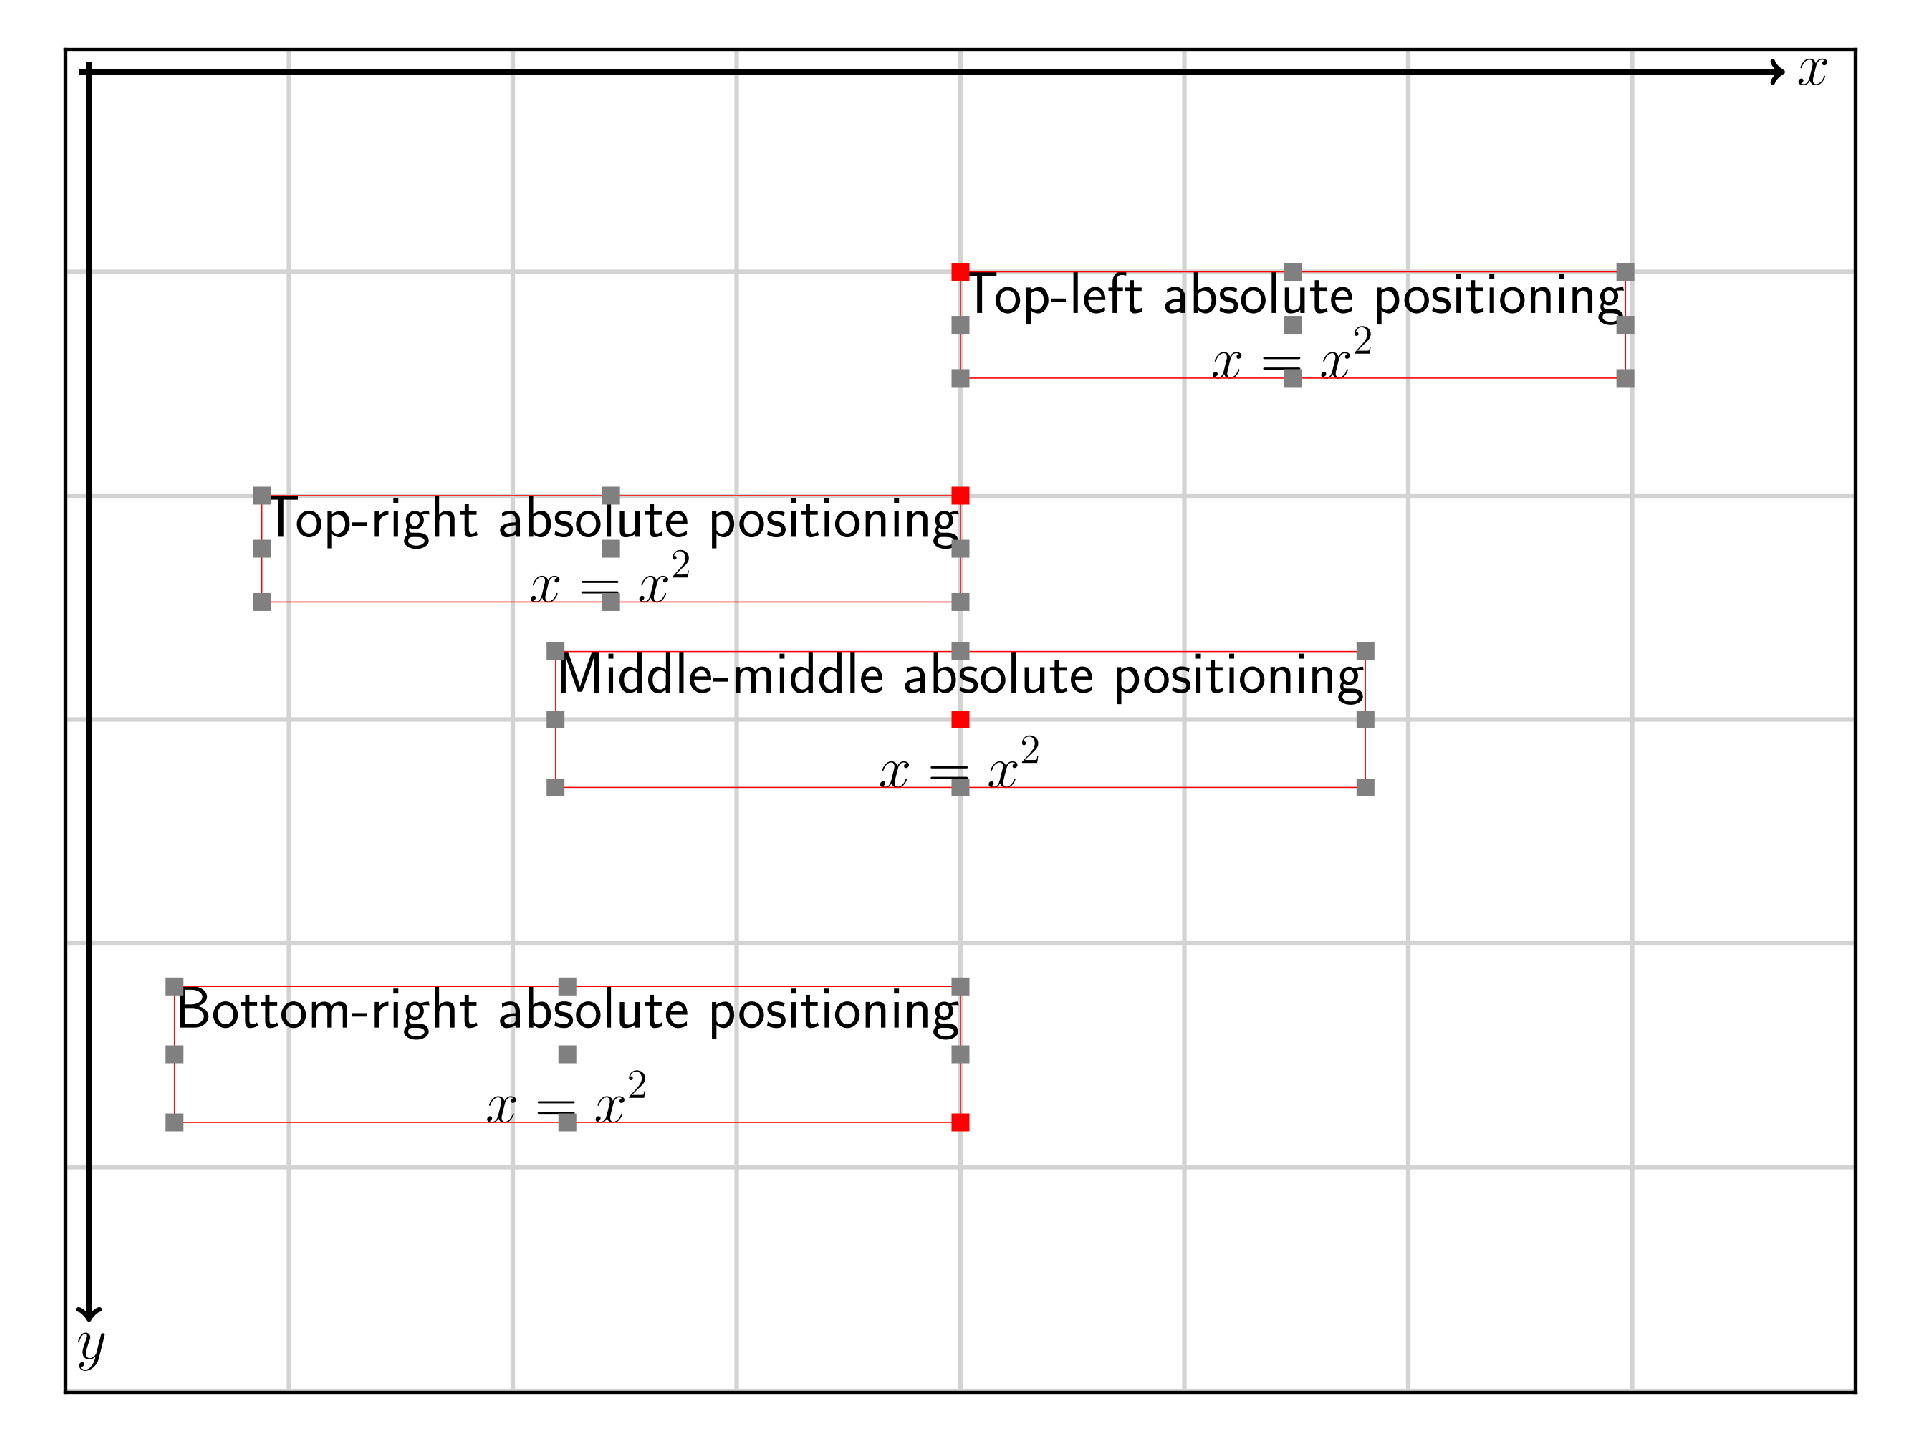
Anchors
We could also change the anchor of the Beampy module using the center, right, bottom function in the coordinate.
with slide():
    draw_axes()

    t1 = text('Top-left absolute positioning $$x=x^2$$', x=400, y=100)

    t2 = text('Top-right absolute positioning $$x=x^2$$', x=right(400), y=200)

    t3 = text('Middle-middle absolute positioning $$x=x^2$$', x=center(400), y=center(300))

    t4 = text('Bottom-right absolute positioning $$x=x^2$$', x=right(0.5), y=bottom(0.6))

    for t in [t1, t2, t3, t4]:
        bounding_box(t)

display_matplotlib(gcs())
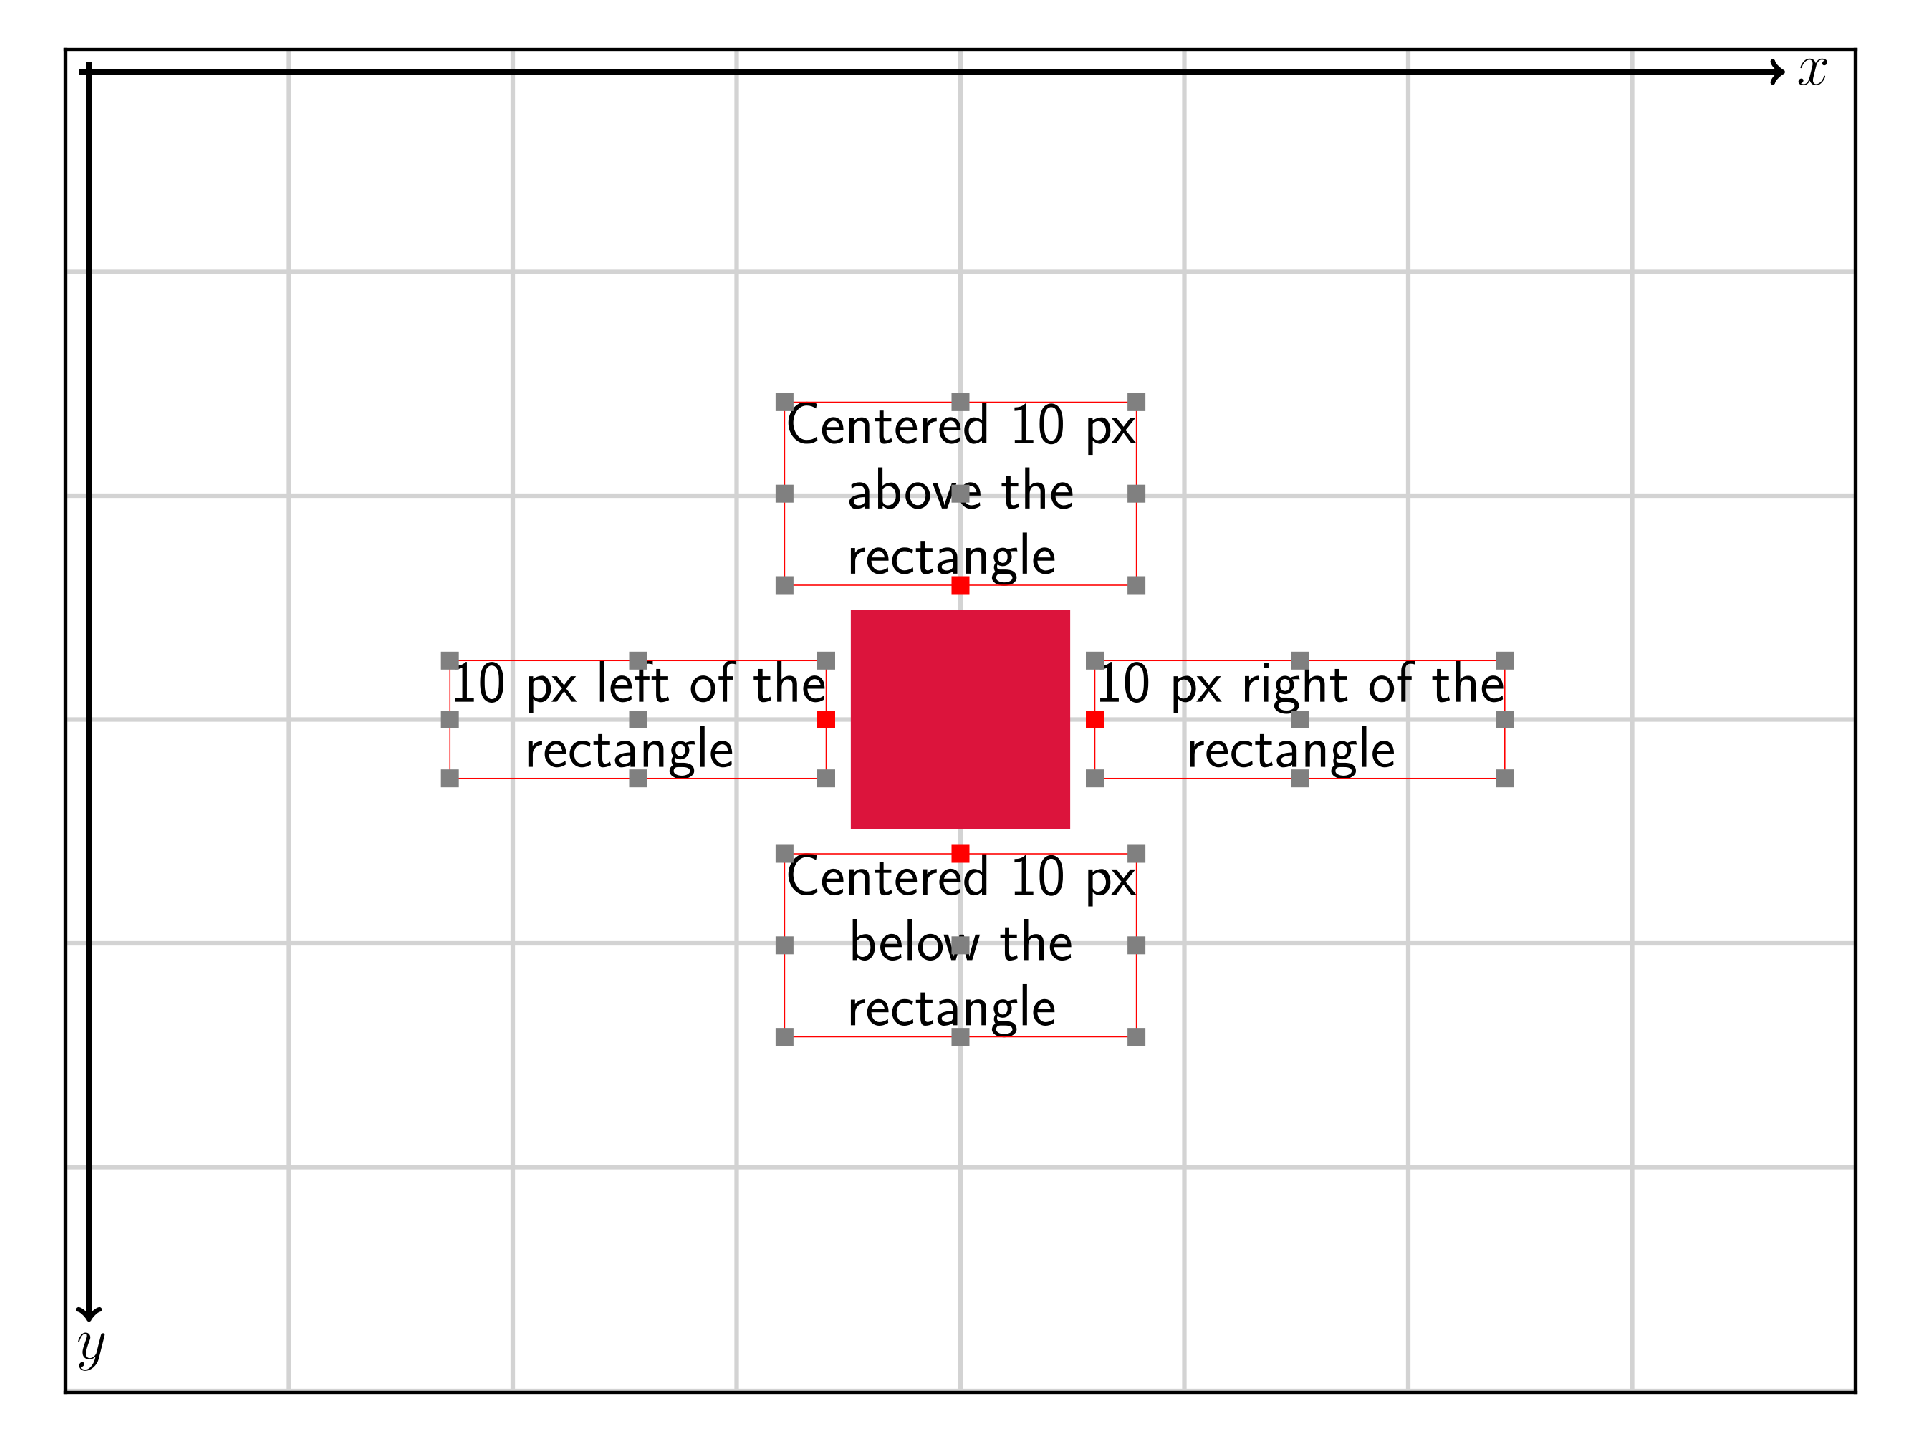
Relative positioning
When a Beampy module as been placed on a slide, we could position an other element relative to this first one. To do so Beampy module have methods to refer to their anchors (module.left, module.right, module.top, module.bottom, module.center).
with slide():
    draw_axes()
    texts_width = 200

    r = rectangle(x='center', y='center', width=100, height=100,
                  color='crimson', edgecolor=None)

    t1 = text('Centered 10 px below the rectangle', x=r.center+center(0),
              y=r.bottom+10, width=texts_width, align='center')

    t2 = text('Centered 10 px above the rectangle', x=r.center+center(0),
              y=r.top-bottom(10), width=texts_width, align='center')

    t3 = text('10 px left of the rectangle', x=r.left-right(10),
              y=r.center+center(10), width=texts_width, align='center')

    t4 = text('10 px right of the rectangle', x=r.right+10,
              y=r.center+center(10), width=texts_width, align='center')

    for t in [t1, t2, t3, t4]:
        bounding_box(t)

display_matplotlib(gcs())
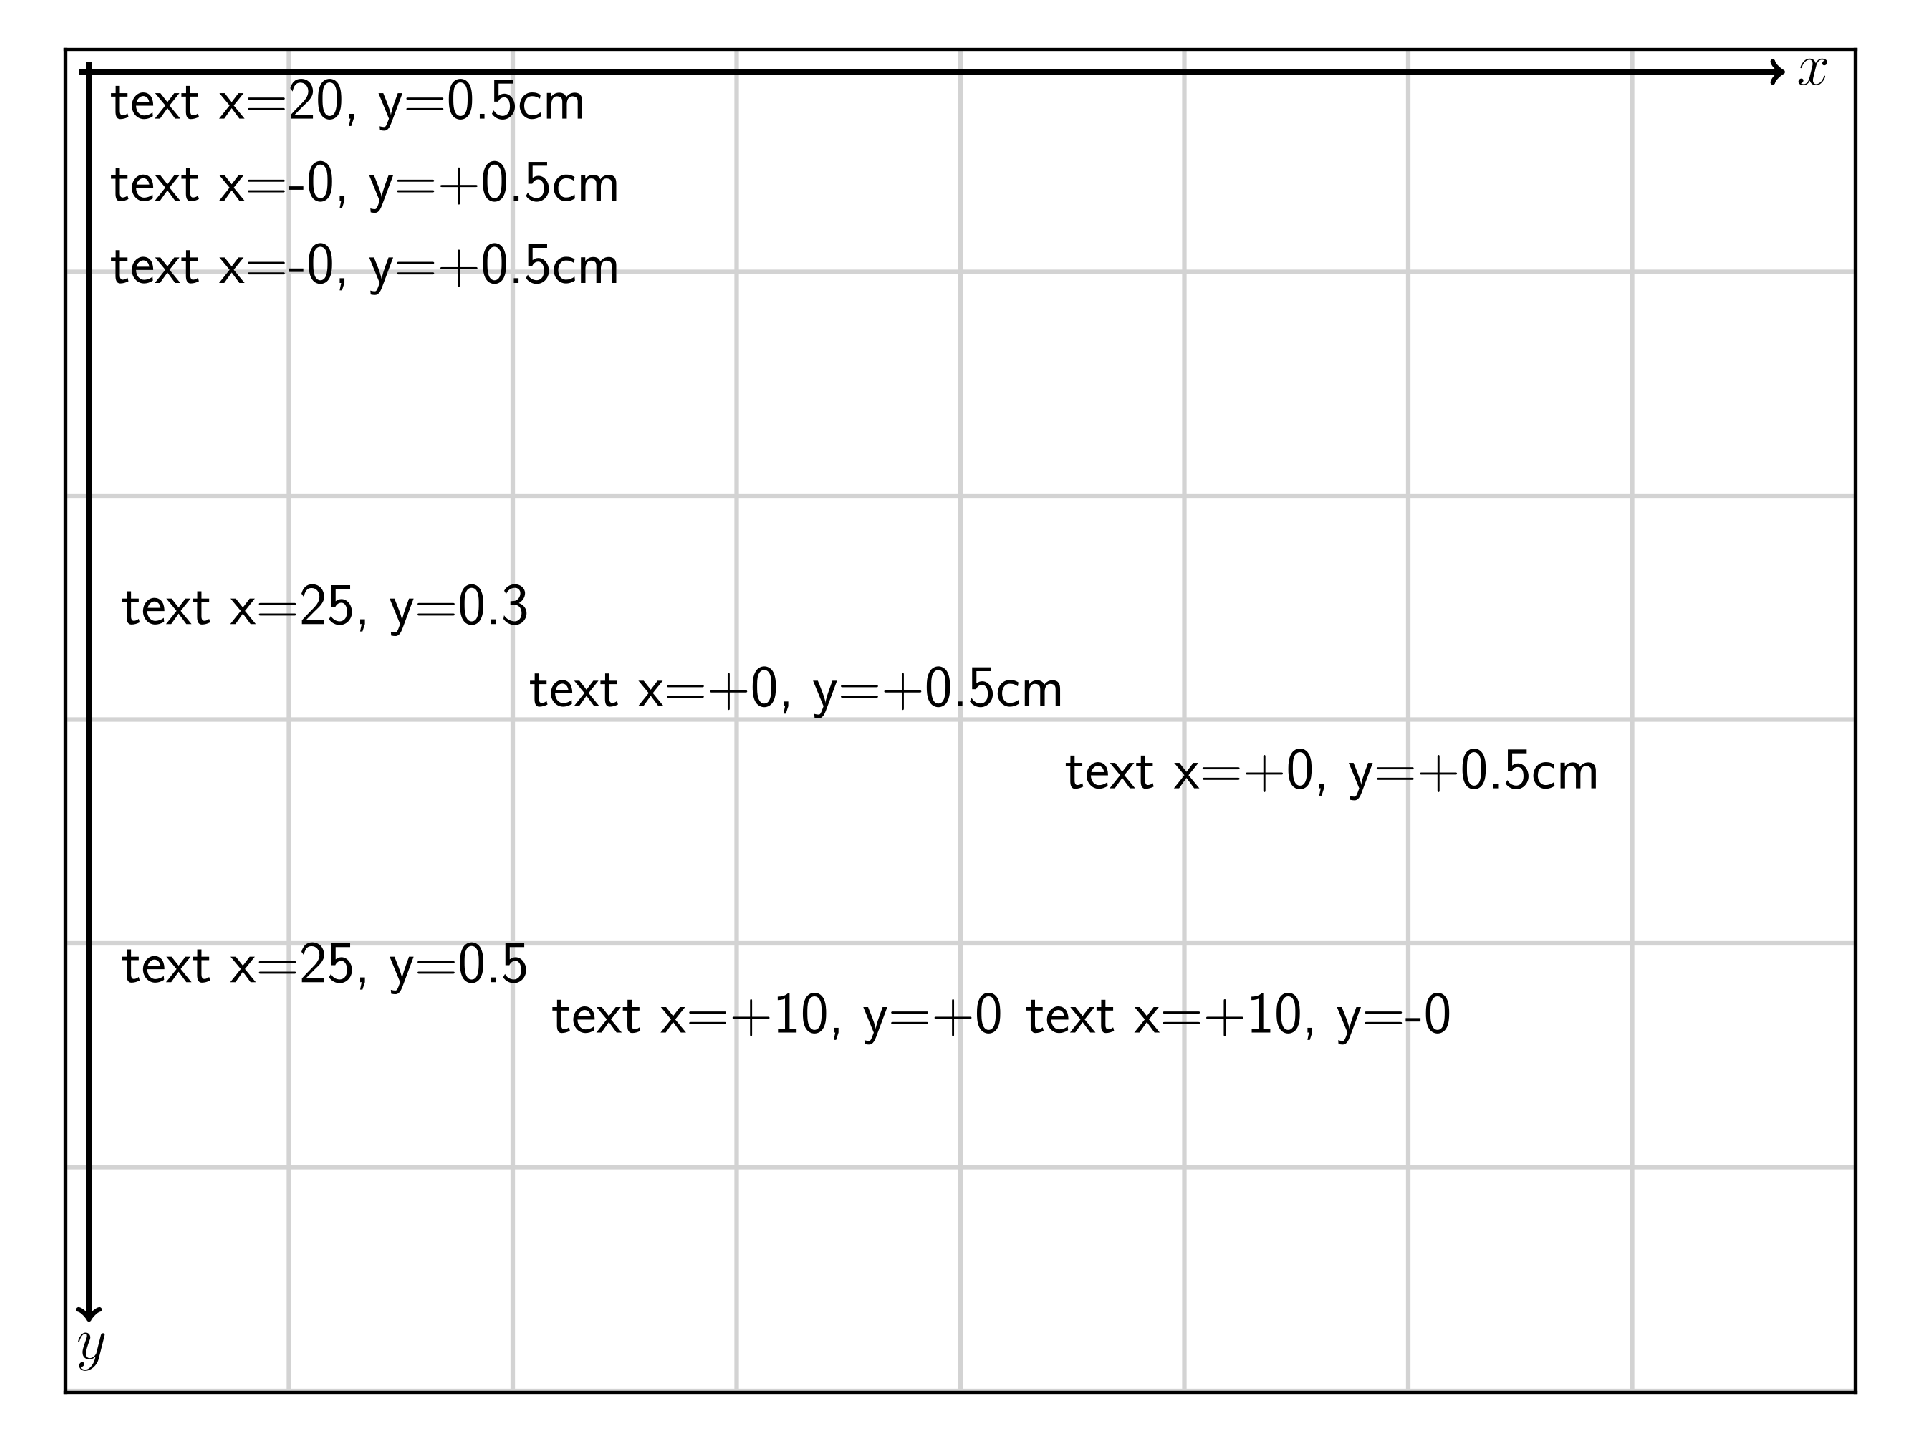
An other way to do relative positioning is to use string as coordinate with ‘+’ ot ‘-‘ before the shift and the unit. This will place the new Beampy Module relative to previous one.
with slide():
    draw_axes()

    text('text x=20, y=0.5cm', x='20', y='0.5cm')
    for i in range(2):
        text('text x=-0, y=+0.5cm', x='-0', y='+0.5cm')

    text('text x=25, y=0.3', x='25', y=0.3)
    for i in range(2):
        text('text x=+0, y=+0.5cm', x='+0', y='+0.5cm')

    text('text x=25, y=0.5', x='25', y=0.5)
    text('text x=+10, y=+0', x='+10', y='+0')
    text('text x=+10, y=-0', x='+10', y='-0')

display_matplotlib(gcs())
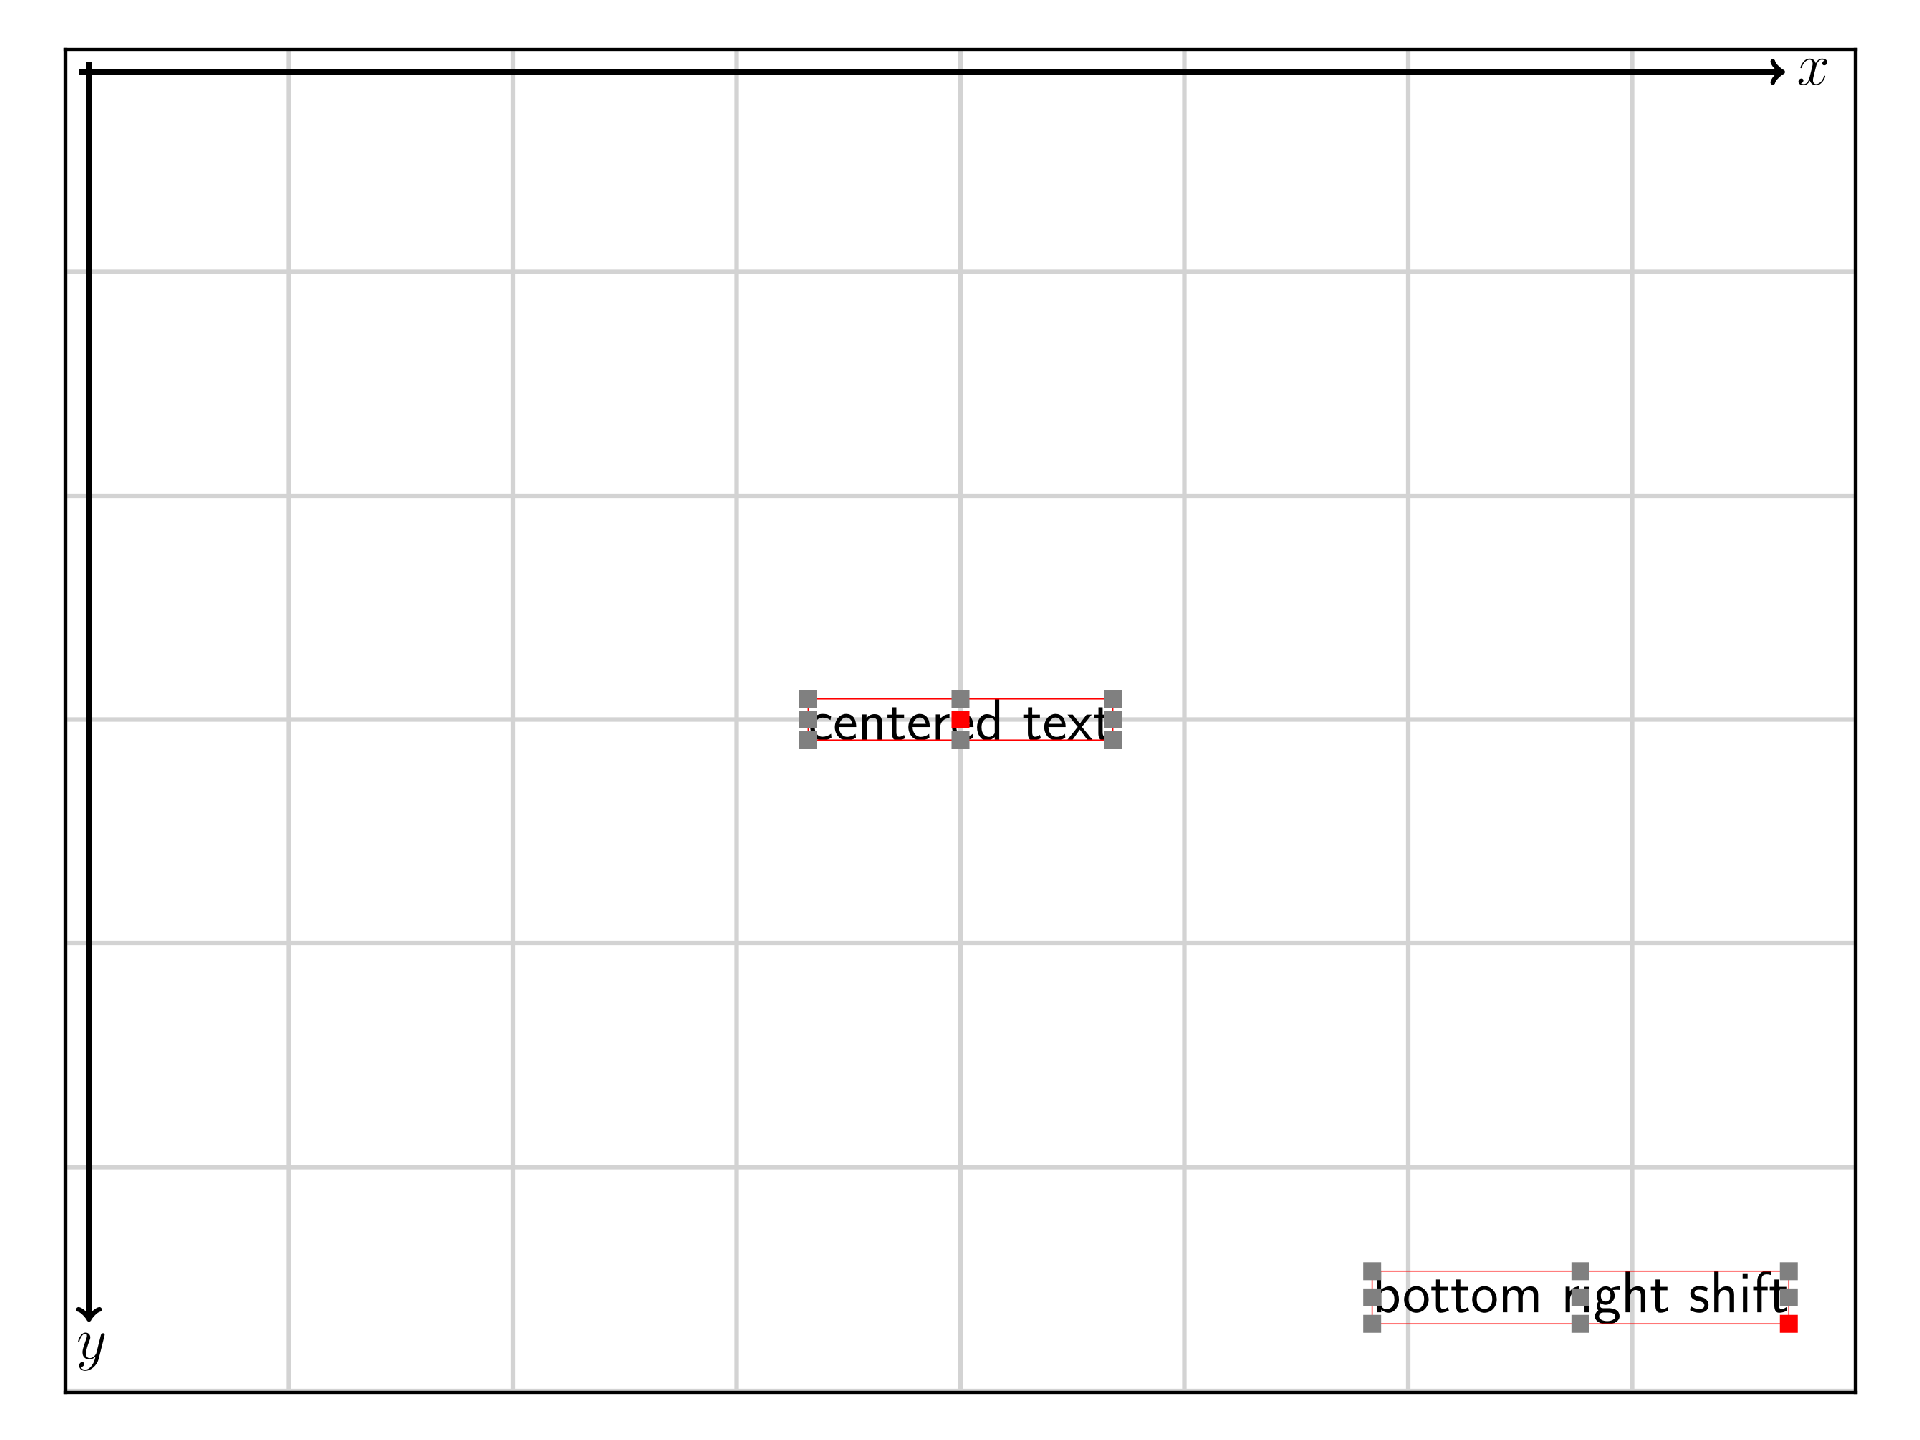
Coordinate as dictionary
Coordinate could also be given as dictionary. The dictionary keys are the following:
- unit: (‘px’, ‘pt’, ‘cm’, ‘width’, ‘height’), the width of the shift value.
- shift: float value, the amount of shifting.
- reference: (‘slide’ or ‘relative’) ‘relative’ is used to make relative positioning.
- anchor: (top, bottom, left, right, middle) define the anchor position on the module bounding-box.
- align: (left, right or center for x) and (top, bottom or center for y) is used to set the origin of slide axes.
with slide():
    draw_axes()

    t = text('centered text',
             x={'anchor':'middle', 'shift':0.5},
             y={'anchor':'middle', 'shift':0.5, 'unit':'height'})
    bounding_box(t)

    t = text('bottom right shift',
             x={'anchor':'right', 'shift':30, 'align':'right'},
             y={'anchor':'bottom', 'shift':30, 'align':'bottom'})
    bounding_box(t)

display_matplotlib(gcs())