Your first presentation
Your first slide: Hello Beampy
A Beampy presentation is based on the document class, in which all slides and their contents will be stored. Let’s create our first slide.
from beampy import *
# We first create a new document for our presentation
# Remove quiet=True to see Beampy compiler output
doc = document(quiet=True)
# Then we create a new slide with the title "My first new slide"
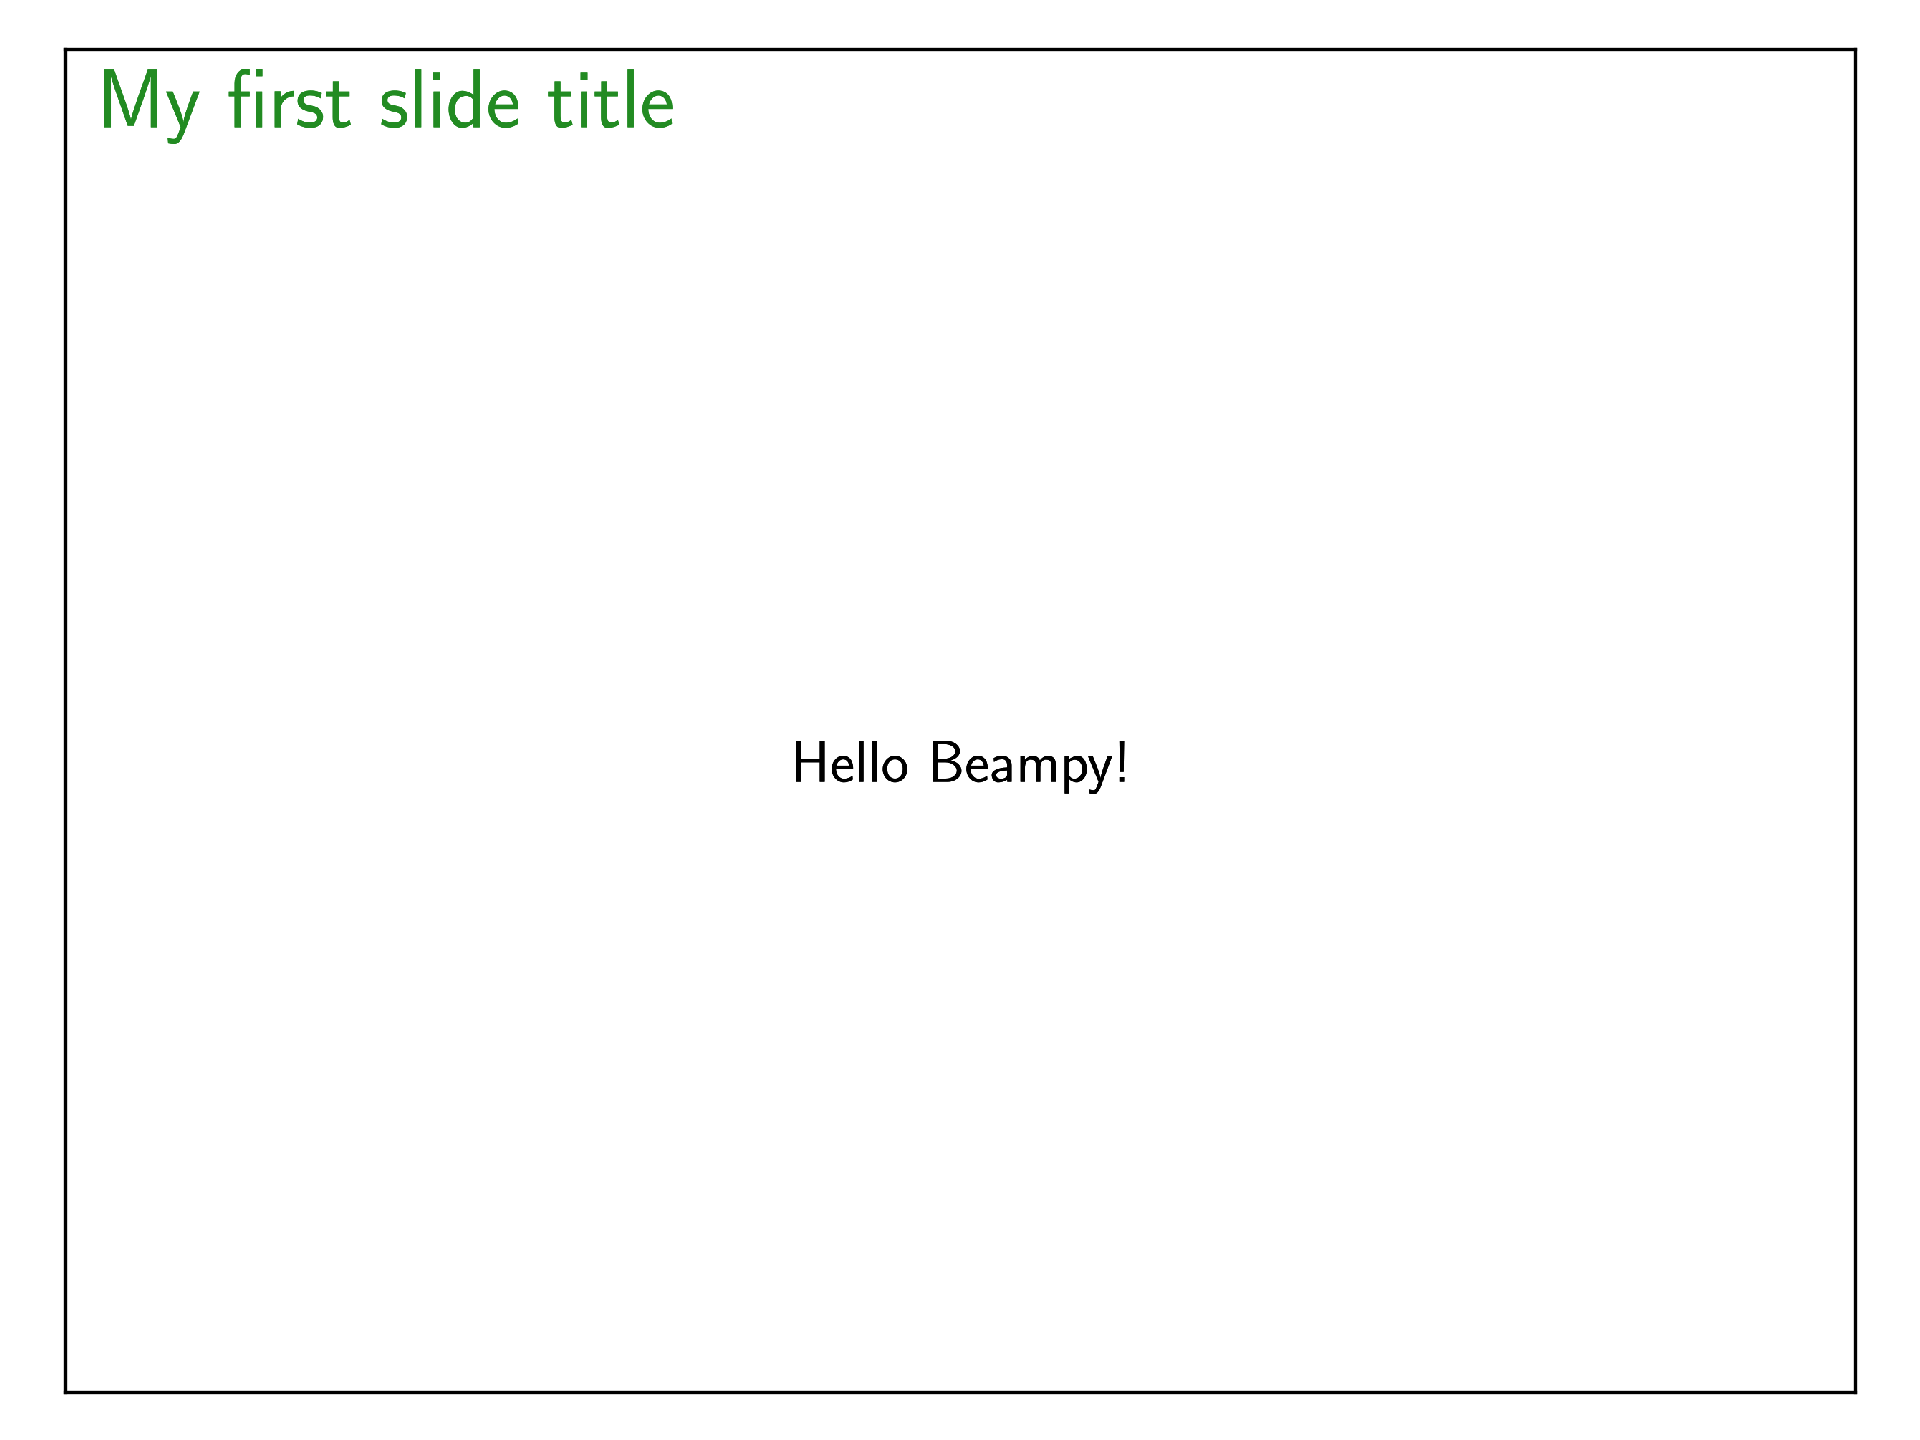
with slide('My first slide title'):
# All the slide contents are functions added inside the with statement.
# Here we add a text content using the Beampy module text
text('Hello Beampy!')
# At the end we save our presentation to an HTML file.
# The save command will launch the compilation of all slides of the
# presentation.
save('hello.html')
# If you want to save it to pdf just change the file extension.
# save('hello.pdf')
# This line is just for displaying the slide in this tutorial webpage
# Remove it in your presentation
display_matplotlib(gcs())
Change the position of the text element
By default the text element is centred in x direction and automatically positioned in y –which means that if you add other elements they will be equally spaced vertically–.
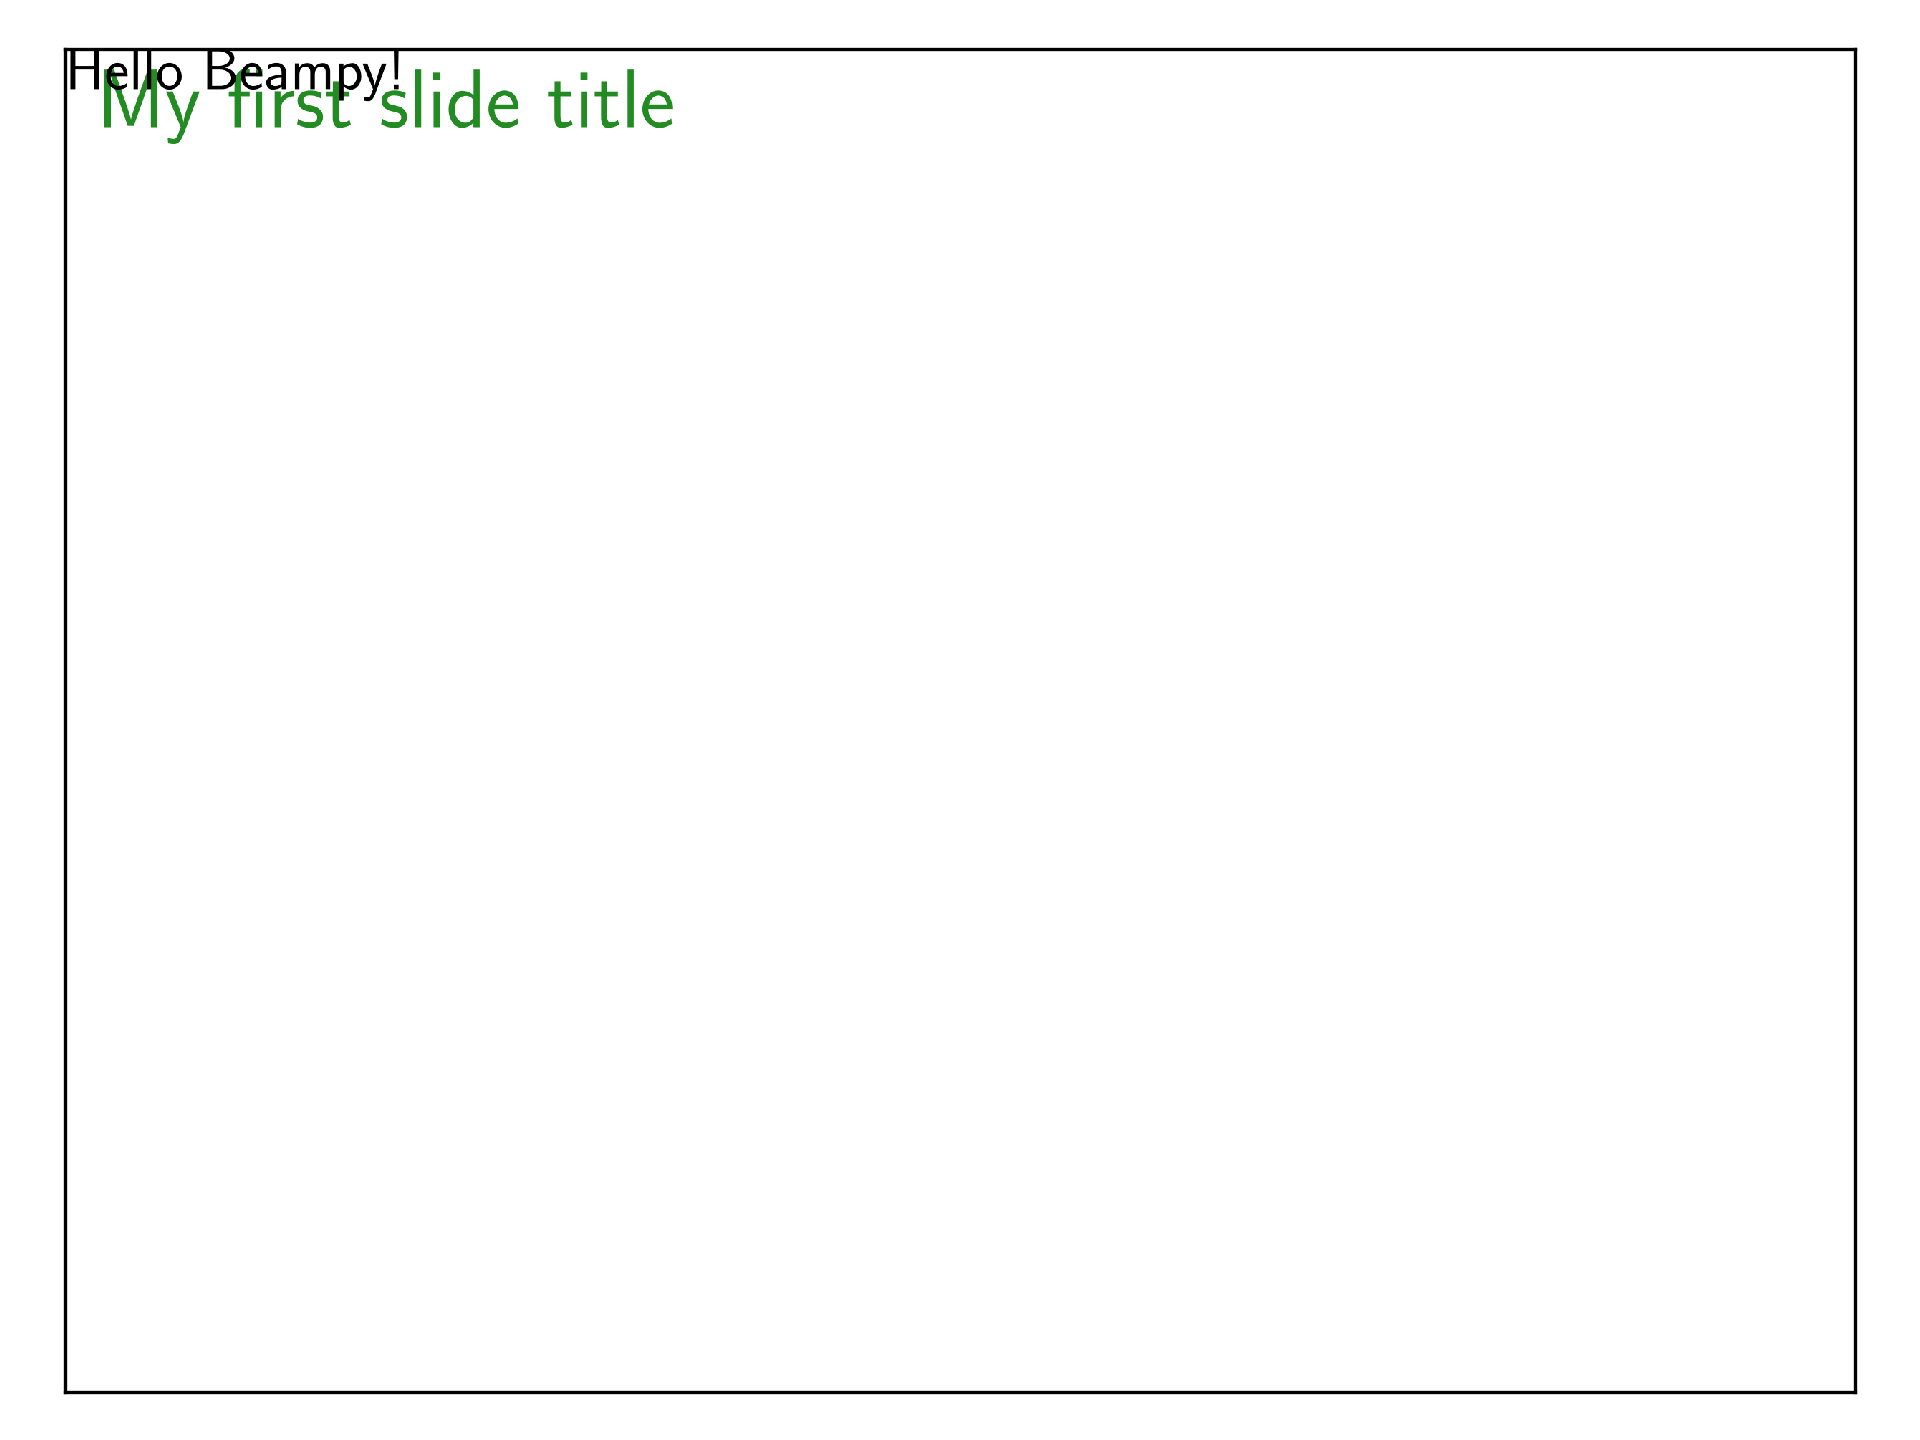
Now we change the x and y with numerical values (x=0, y=0), the text is now in the upper-left corner.
with slide('My first slide title'):
    text('Hello Beampy!', x=0, y=0)

display_matplotlib(gcs())
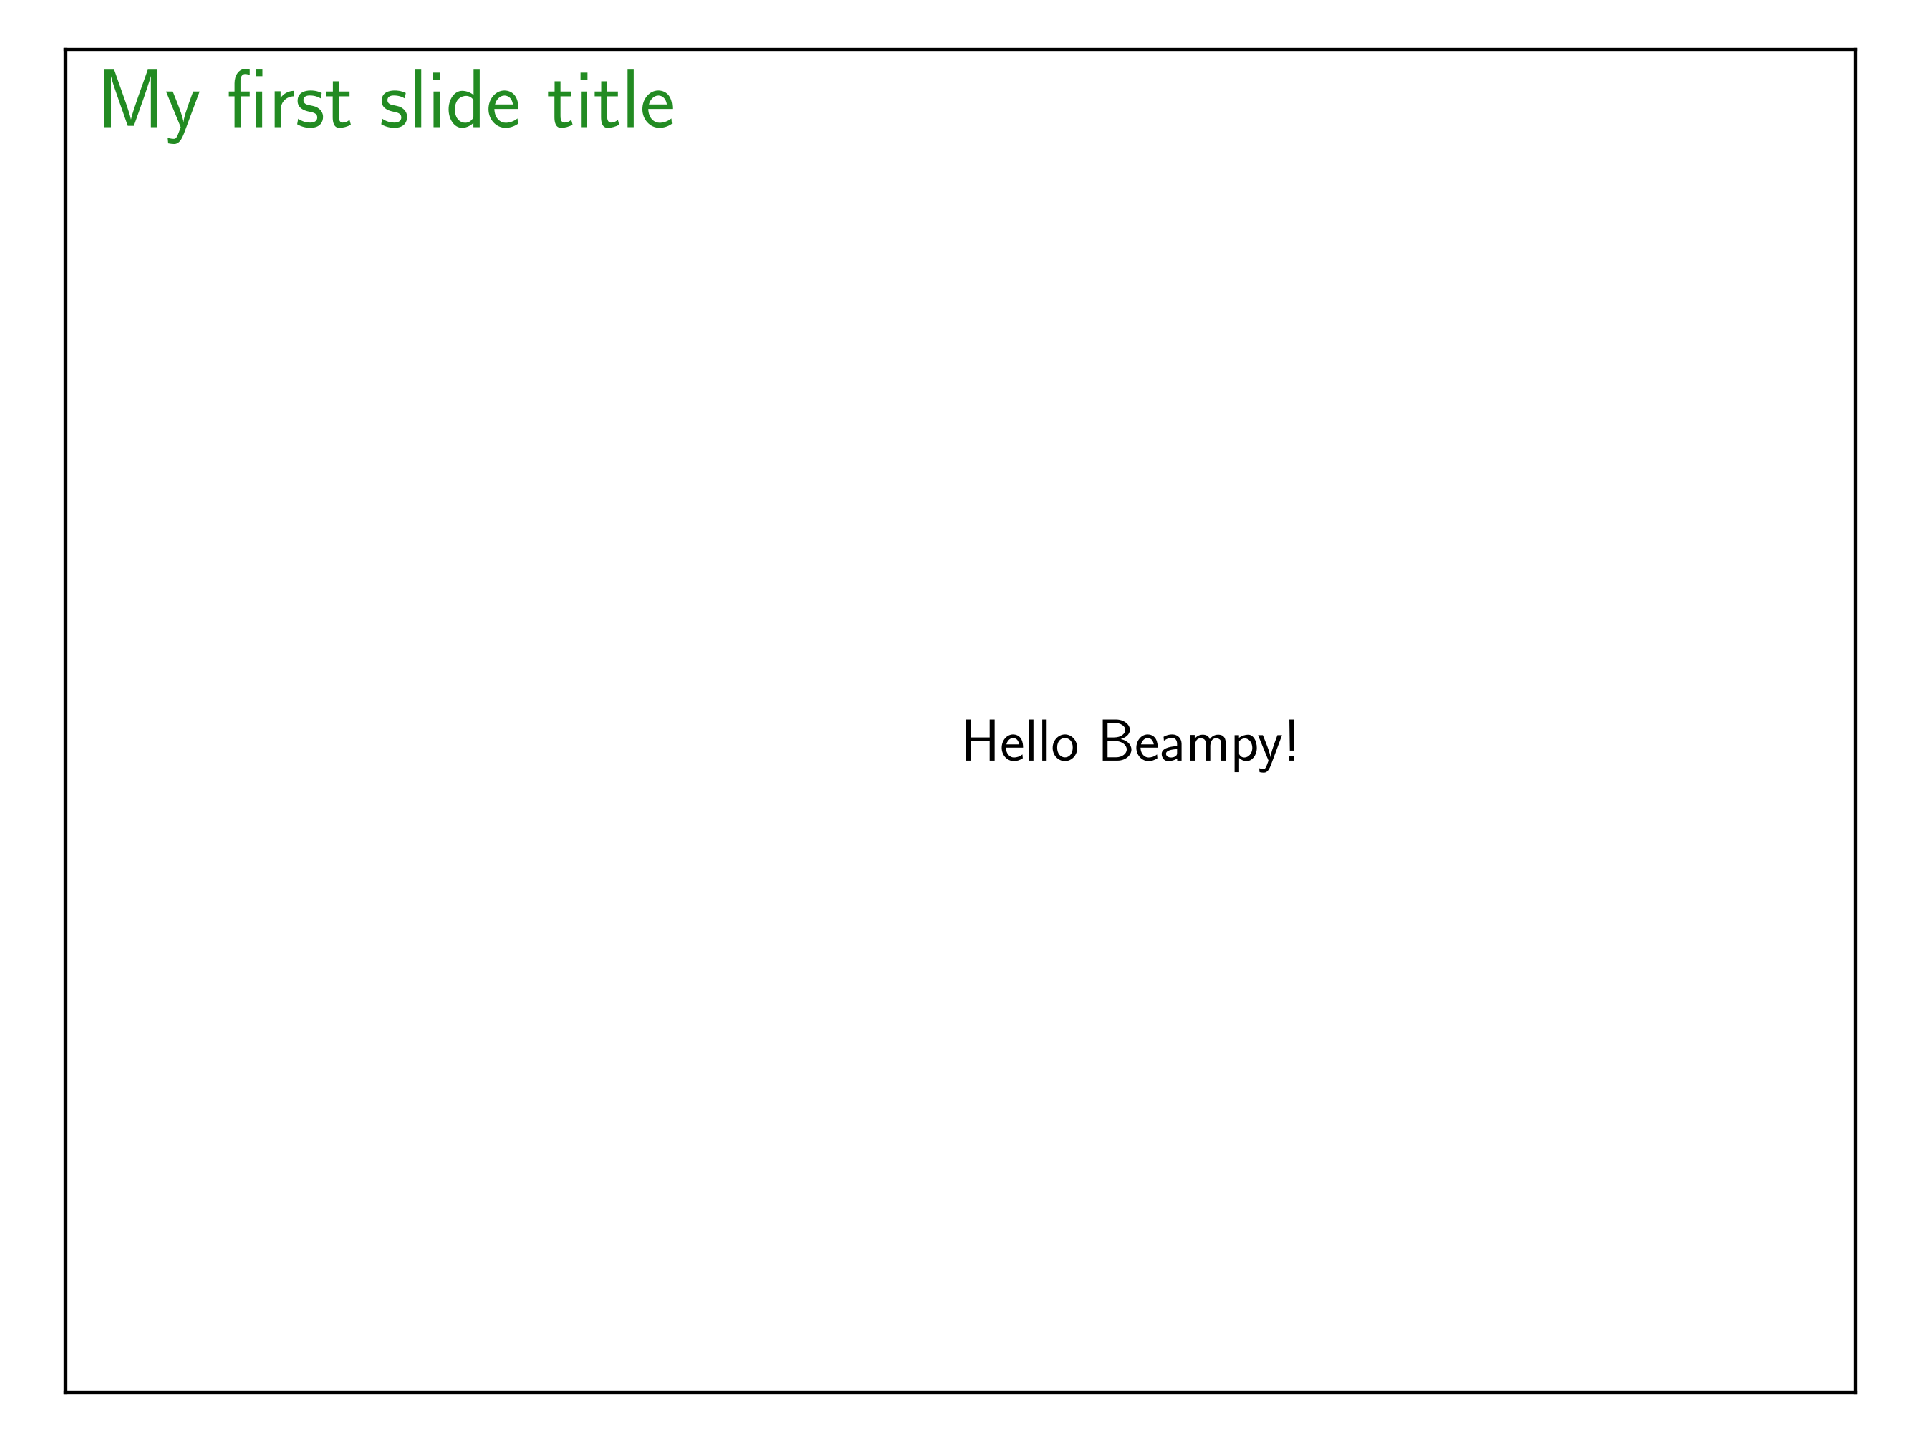
When value of x and y are lower than 1.0, they are by default in percent of slide (or group) width. So if you set x=0.5 and y=0.5x3/4 (as the aspect ratio of the theme is 4/3) the text will be anchored (default anchor is upper-left) to the center of the slide.
with slide('My first slide title'):
    text('Hello Beampy!', x=0.5, y=0.5*3/4.)

display_matplotlib(gcs())
Now we could also set fixed position for x and y. To do so, if x and y are greater than 1.0 and their coordinates will be in pixel.
with slide('My first slide title'):
    text('Hello Beampy!', x=100, y=100)

display_matplotlib(gcs())
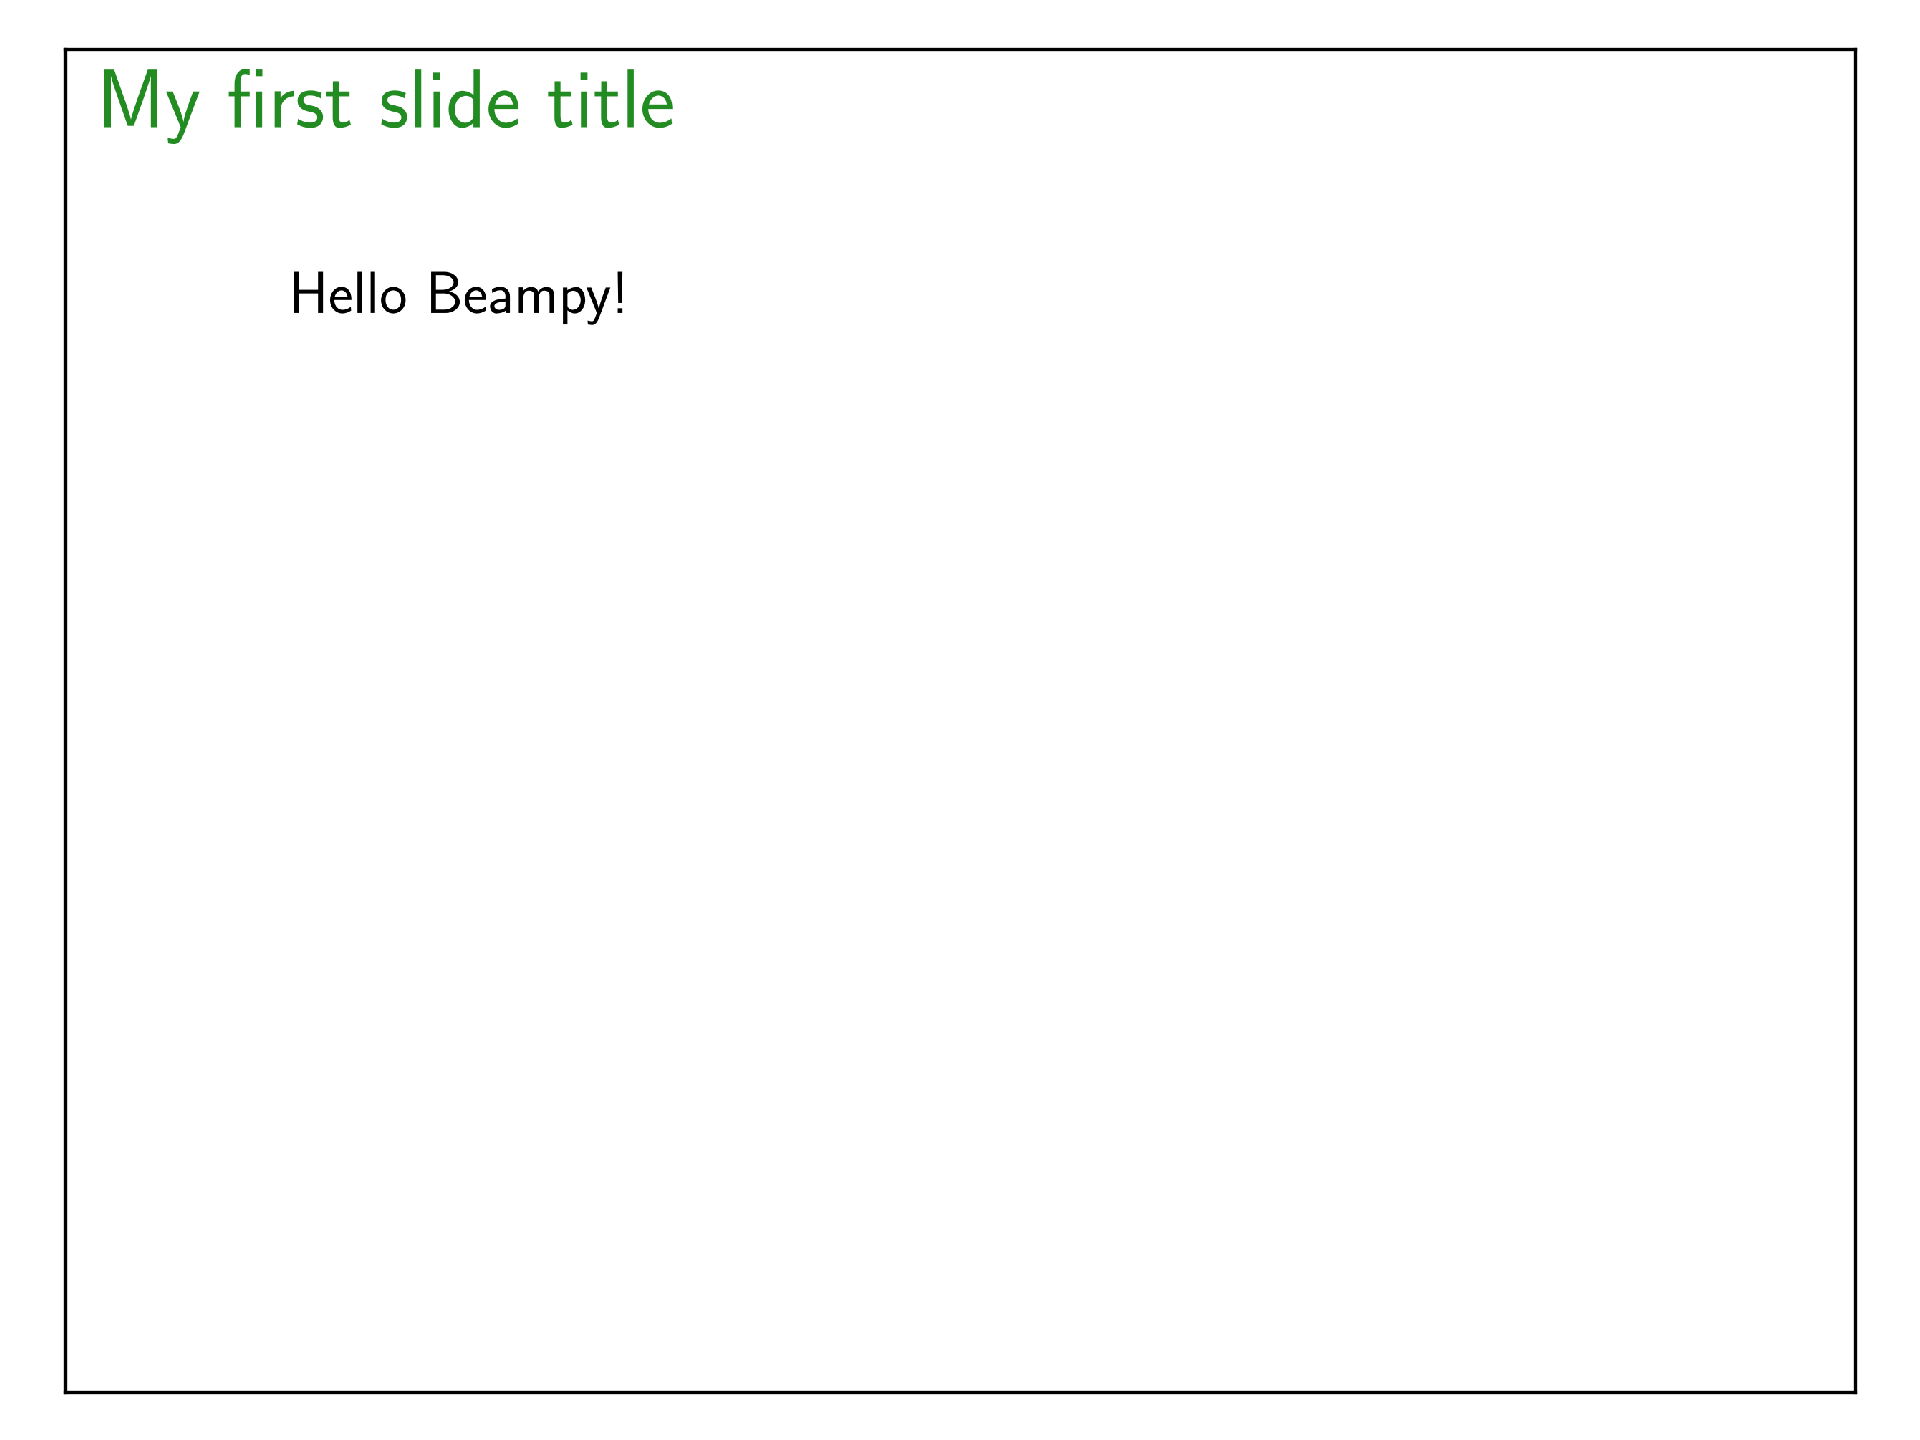
You could also give coordinates as strings and specify the units (cm, pt), like x=‘2cm’.
Congratulation you have created your first Beampy slide. You can now look at:
- The gallery of Beampy Modules to include other elements than text and get Beampy modules options.
- The tutorial on Beampy Positioning system.